On-chart Teardown 7 площадок → zerox-chart
Реверс UX, анимаций, таймингов и чарт-технологии бинар/казино-площадок и проект порта на наш WebGL2-движок без потери интерфейса и интерактива. Июнь 2026.
Доступ к демо и стены логина
Живая интерактивная механика (win/lose-анимации) на всех 7 за логином — реконструированы из видео. Что открывает каждую стену — один сигнап от тебя.
| Площадка | Демо | Рендер | Движок | OSS |
|---|---|---|---|---|
| Deriv (app.deriv.com) — DTrader options trading platform | неизвестно | canvas2d | SmartCharts (deriv-com/SmartCharts) — three-layer hybrid: Re | ✅ |
| BC.Game / detrade.com | неизвестно | mixed | ChartIQ (Canvas 2D, Up/Down + High-Low + Spread + Tap Tradin | — |
| IQ Option (iqoption.com) — веб-платформа трейдрума | неизвестно | webgl | Quadcode WebGL engine (проприетарный, IQ Option/Quadcode whi | — |
| Pocket Option (pocketoption.com / po.trade) | неизвестно | canvas2d | Proprietary custom Canvas 2D engine (in-house, Vite SPA buil | — |
| Quotex / QxBroker (qxbroker.com — official mirror of quotex.io) | неизвестно | canvas2d | Proprietary custom Canvas 2D engine (in-house, not TradingVi | — |
| Stockity (stockity.id) — binary options platform, technically identical to Binomo (Tiburon Industries / Dolphin Corp ecosystem). Same Phoenix Channels WS protocol, same REST API structure. Registered: Verte Securities Limited, Vanuatu. Infrastructure: api.stockity.id, ws.stockity.id. Mechanisms: Fixed Time Trades (Binary Up/Down), Turbo (option_type="turbo"). Target audience: Indonesia (primary), Southeast Asia. | неизвестно | canvas2d | Proprietary in-house chart engine (Binomo/Tiburon ecosystem, | — |
| Binomo (binomo.com) — Fixed Time Trades / Turbo / DRT / Tournaments, proprietary web platform by Dolphin Corp (SVG / Vanuatu) | неизвестно | webgl | Proprietary (Binomo/Tiburon) — WebGL рендер (2 canvas-контек | — |
⛔ Live-блокеры
- BC.Game — Сам график/игра за Sign in — без логина видна только казино-лента + стена входа, canvas не грузится (casino-account)
- Quotex (qxbroker.com) — Демо редиректит на /sign-in — живая механика за логином (email-signup)
- ALL 7 — Интерактивные механики (win/lose анимации) требуют аккаунт на каждой площадке — реконструированы из видео (signup per platform)
Deriv (app.deriv.com) — DTrader options trading platform OPEN SOURCE
✅ LIVE-VERIFIED на демо-счёте (19 Jun 2026). Deriv SmartCharts is fully open-source (MIT flutter-chart + Apache SmartCharts JS). Renderer is Canvas 2D via Flutter CustomPainter (NOT WebGL). All barrier, accumulator corridor, marker, and shade drawing code was directly extracted from GitHub. Key timings confirmed from source: tick animation 300ms easeInOut, active marker entry 250ms easeInOut, blinking dot continuous sine. Barriers prop API fully documented. All 7 game mechanics map to 5 WebGL2 layers on zerox-chart with exact parameter values extracted from source. [LIVE] Каталог 9 типов сделок (меню Trade types): Growth — Accumulators/Multipliers/Turbos/Vanillas; Directional — Rise-Fall/Higher-Lower/Touch-NoTouch; Digit — Matches-Differs/Over-Under/Even-Odd. 🧩 Интерактивная реконструкция: /repro/deriv.html
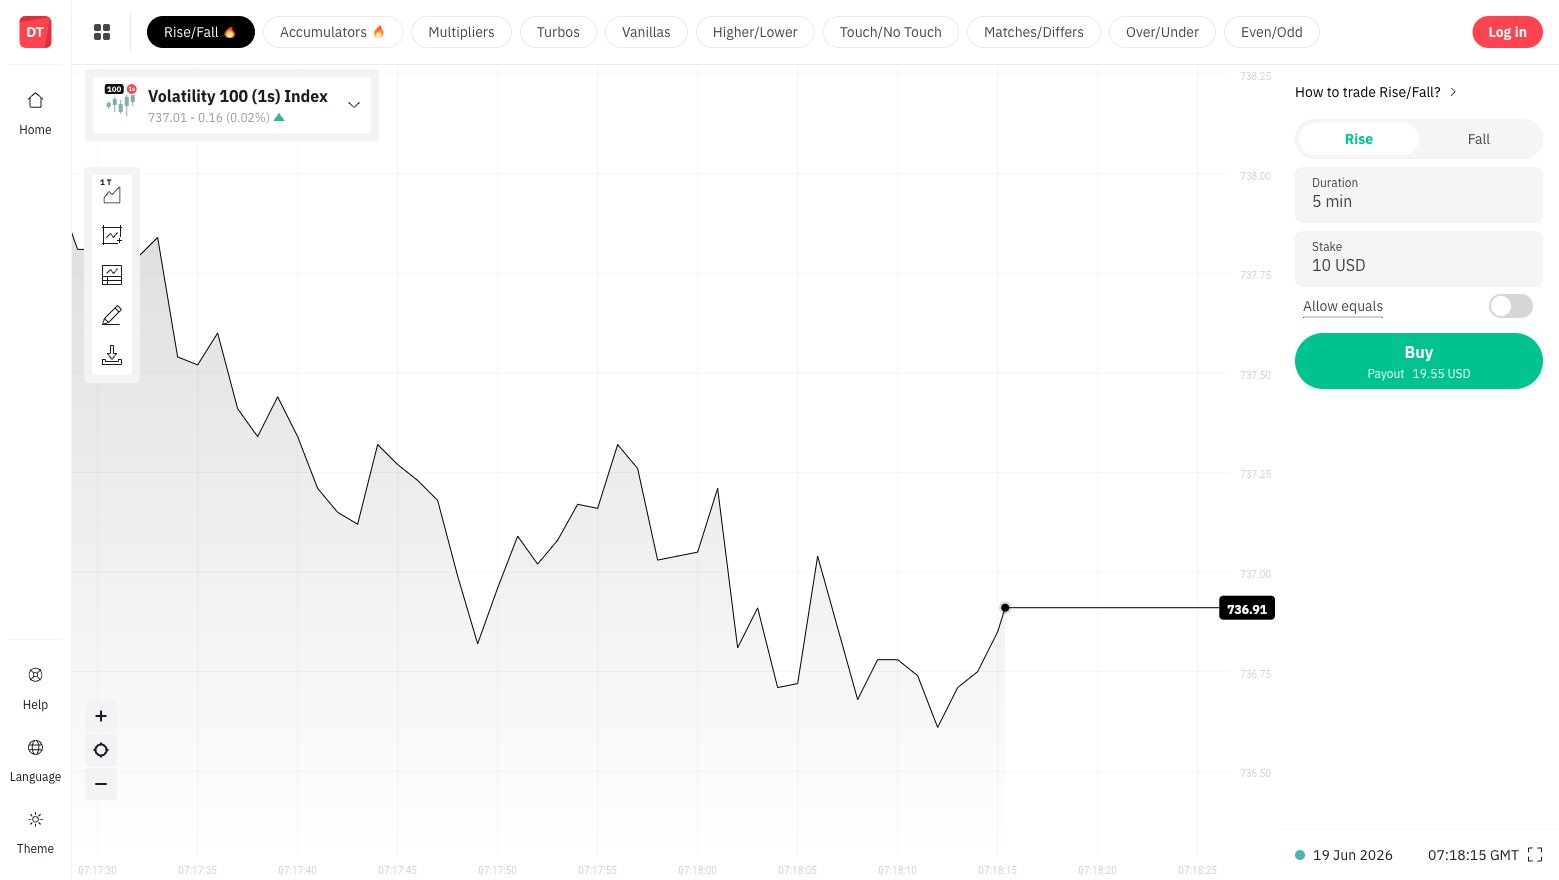
Up/Down binary (Rise/Fall, Higher/Lower)
- Single horizontal barrier line (solid, draggable or fixed) at entry price level — rendered as absolutely positioned .chart-line.horizontal div, 1px border-top in barrier color
- Shade ABOVE (for CALL) or BELOW (for PUT): CSS div .shade.top-shade/.bottom-shade with linear-gradient, opacity 0.3, scaled via CSS transform:scale(1, factor) by ShadeStore.setPosition
- SHADE_ABOVE: aboveShadeStore visible, belowShadeStore hidden; SHADE_BELOW: reversed
- Vertical start-line at contract entry epoch: flutter VerticalBarrierPainter draws canvas.drawLine(x, dotY, x, size.height-20) with isDashed=true via paintVerticalDashedLine (canvas2d setLineDash)
- Entry dot on price at start epoch: paintDotWithGlow(canvas, offset, dotRadius=3) + optional blinking glow ring
- P&L badge label floating near current tick position via FastMarker DOM overlay
| Анимация | Как работает | Длит. | Easing |
|---|---|---|---|
| Barrier Y lerp (tick-to-tick) | On each tick, PriceLineStore.drawBarrier(currentTickPercent) interpolates barrier Y position between previous and current tick's price using lerp(previousQuote, currentQuote, currentTickPercent). currentTickPercent runs 0→1 each tick via Flutter AnimationController with _defaultDuration=300ms, easing=Curves.easeInOut (from basic_chart.dart: const Duration _defaultDuration = Duration(milliseconds: 300)). | 300ms | easeInOut |
| Shade scale transition | ShadeStore.setPosition() updates CSS transform:translate/scale on the shade div every time barrier price changes or epoch/quote bounds change. No CSS transition declared — instant update keyed to Painter callback. Shade becomes visible/hidden via .hidden class toggle (opacity:0 when hidden, opacity:0.3 when visible — no transition on opacity). | instant (no CSS transition on shade opacity) | none |
⏱ Contract duration configurable from 1 tick to years. WS tick rate: ~1s for synthetic indices (R_100, 1HZ100V). Barrier draggable in real-time with onChange callback on drag-release.
👁 Из видео: ✅ LIVE: Rise/Fall на Volatility 100 (1s), тиковый area-график, Duration 5min, Stake 10 USD, Payout 19.25 USD, тулбар (chart-type/индикаторы/рисование/download). Video YGVJ4Q5hjgc (1:05): Touch/No Touch variant seen; barrier line visible as horizontal rule on tick chart with shaded zone above/below. Video f8_lACMiNsw (0:46): ticks chart with horizontal barrier line, barrier offset input field, touch history panel.
1. BarrierLayer (WebGL2): single draw pass — horizontal price line as LINES primitive from x=epochToX(startEpoch) to x=chartRight, Y=priceToY(barrierPrice). Line width 1px, color uniform. 2. ShadeLayer (WebGL2 filled quad): screen-aligned rect from Y=priceToY(barrierPrice) to Y=top or Y=bottom of viewport, X=full width. Alpha blend 0.3 with shade color. Shader branch on shade_mode uniform (0=ABOVE: rect from barrier Y to viewport top; 1=BELOW: barrier Y to viewport bottom; 2=BETWEEN: between two barrier Ys). 3. StartLine: vertical dashed line — in WebGL2 implement as LINES with manual dash via fragment shader (gl_FragCoord.y mod dashLength < dashLen ? discard : keep) or as instanced short segments. 4. EntryDot: point sprite at (epochToX, priceToY) — radius 3px filled circle + pulsing outer ring driven by uniform blinkPhase = (Date.now() % 1200) / 1200. 5. Barrier Y animation: each tick, store previousY and targetY; in rAF loop lerp with t = min(elapsed/300, 1) using easeInOut curve t=t<0.5?2*t*t:(−2*t*t+4*t−1). Pass lerped Y as uniform to shader. 6. Barriers prop API: {high, low, shade:'ABOVE'|'BELOW'|'BETWEEN'|'OUTSIDE'|'NONE_SINGLE'|'NONE_DOUBLE', color, shadeColor, draggable, lineStyle:'solid'|'dashed'|'dotted', hideBarrierLine, hidePriceLines, isSingleBarrier, onChange}.
Touch/No-Touch (OneTouch/NoTouch)
- Single horizontal target barrier line (isSingleBarrier=true in BarrierStore, only high_barrier rendered)
- SHADE_ABOVE for OneTouch-above / SHADE_BELOW for NoTouch contracts (configurable)
- Barrier line labeled with barrier value via drag-price DOM element
- Draggable barrier: makeElementDraggable(line, subholder) enables ns-resize cursor on hover, dragStart/drag/dragRelease events, priceConstrainer prevents crossing
- Offscreen arrows: when barrier is outside visible price range, ABOVE/BELOW arrow indicators shown (showOffscreenArrows prop)
- Vertical start-line at trade epoch (VerticalBarrierPainter, isDashed=true)
| Анимация | Как работает | Длит. | Easing |
|---|---|---|---|
| Barrier hit flash | On contract win (price touches barrier), shade color and line color transition to accentGreen. In flutter-chart AccumulatorIndicatorPainter (color logic applies to all barriers): if profit > 0 color=LegacyLightThemeColors.accentGreen, if profit < 0 color=accentRed. Color change is immediate (no lerp) on next paint frame. | instant on next frame | none |
| Network status blinker | CSS @keyframes blinking-network-status: 40% {opacity:1} 100% {opacity:0} — 0.4s infinite alternate, on .sc-connection-status--blinker indicator dot. Not on chart surface. | 0.4s infinite | alternate |
⏱ Duration: 5 ticks to 365 days. Barrier offset: relative (+0.001 above current) or absolute price. Tick subscription: msg_type='tick' at ~1Hz for synthetic indices.
👁 Из видео: Video YGVJ4Q5hjgc (1:05): Single horizontal barrier with shade above; draggable UI with barrier offset input. Video 1Em7-AcyXtI (0:41): touch target barrier as single colored horizontal line.
Same BarrierLayer as Up/Down but with isSingleBarrier=true (only high barrier rendered). Shade is ABOVE or BELOW depending on contract type. Draggable barrier: add pointer-events to the horizontal line DOM overlay (FastMarker-style) with mousedown→mousemove→mouseup drag handler, snapping price to tick grid. On drag-release fire onChange({high: newPrice}). Offscreen arrows: DOM absolute elements positioned at canvas top/bottom edge when barrier Y < 0 or > chartHeight.
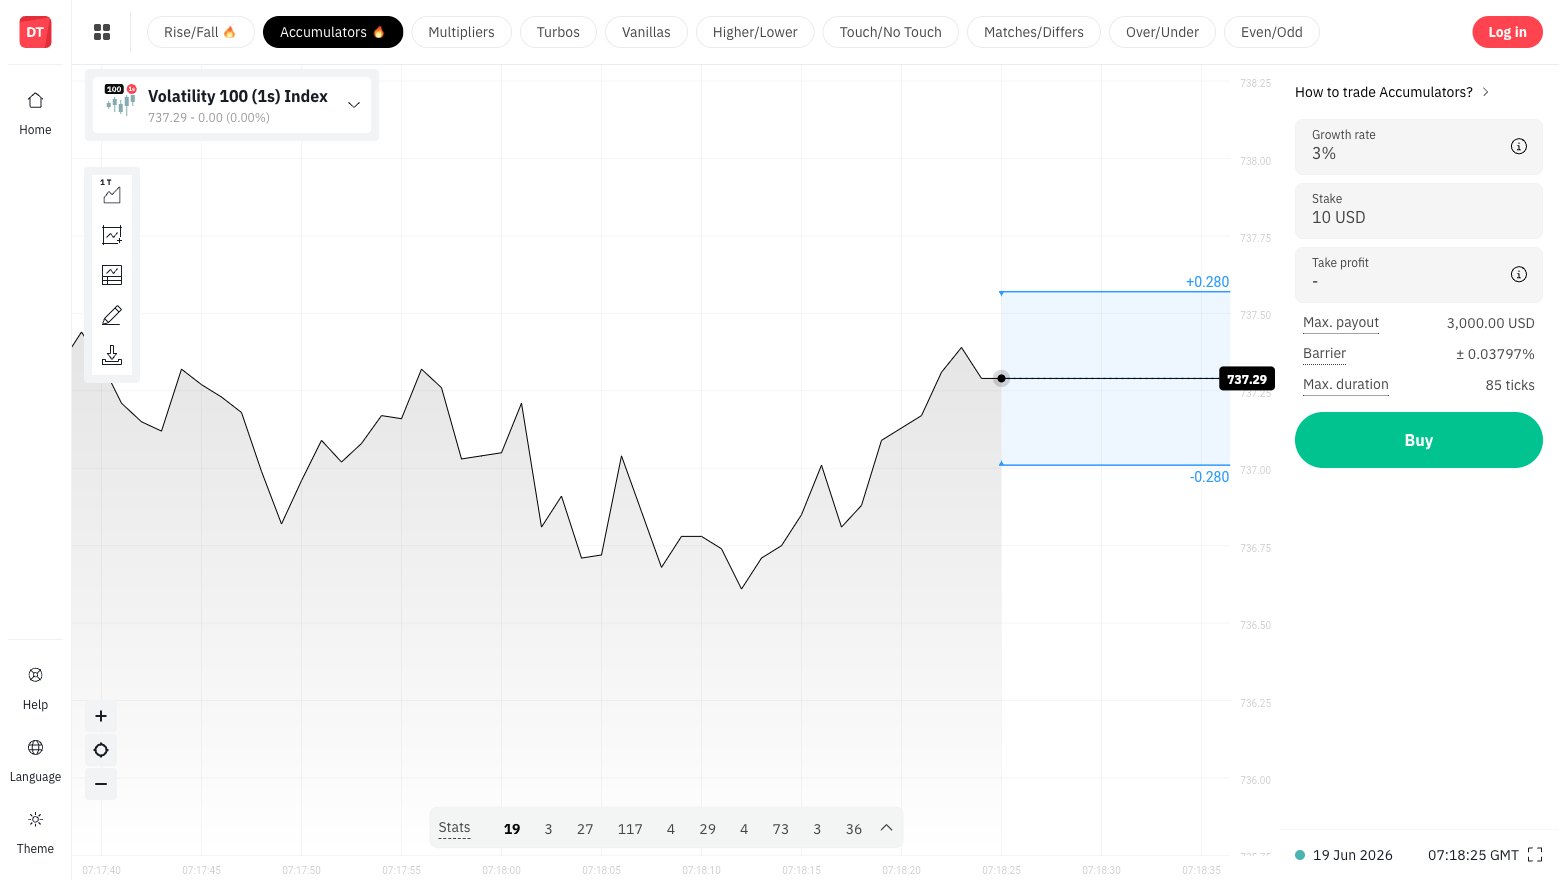
Accumulators (corridor growth-rate options)
- Two horizontal barrier lines (top/bottom corridor) drawn by AccumulatorIndicatorPainter on flutter canvas: canvas.drawLine(lowBarrierPos, Offset(size.width, lowBarrierPos.dy), _linePaint) and same for high barrier. strokeWidth=1.
- Corridor fill rect: canvas.drawRect(Rect.fromPoints(highBarrierPosition, Offset(size.width, lowBarrierPosition.dy)), _rectPaint) where _rectPaint.color = color.withOpacity(0.08). So 8% opacity fill.
- Triangle markers at barrier start epoch: upper triangle (4px edge, 5px height, pointing down) and lower triangle (pointing up) drawn as Path, filled + stroked in barrier color.
- Barrier distance text labels: paintText(canvas, text:'-${barrierSpotDistance}', anchor: lowBarrierPos + Offset(30,10)) and '+${barrierSpotDistance}' at high barrier. fontSize=12.
- Blinking glow between barriers at barrier epoch (not at tick): paintBlinkingGlow at midpoint of corridor, two concentric circles (fullSize=12, alpha=50 and fullSize=6).
- Live profit text between tick and right label: profitPainter (fontSize=26) + currencyPainter (fontSize=14) rendered mid-corridor, line split around text to avoid overlap.
- Entry spot dot: AccumulatorsEntrySpotBarrierPainter draws paintAccumulatorsEntrySpot (filled circle at startEpoch/entryPrice) + horizontal dashed line from entry to current tick.
- After contract close: AccumulatorsClosedIndicatorPainter renders same corridor rect (0.08 opacity) + barrier lines + triangles in green/red based on profit sign, with exit tick dot.
- Recently-closed variant: corridor extends only to barrierEndEpoch (fixed width, not to size.width).
- Auto-zoom: should_zoom_out_on_yaxis prop forces y-axis zoom out to keep barriers visible.
| Анимация | Как работает | Длит. | Easing |
|---|---|---|---|
| Barrier corridor lerp (per-tick smooth movement) | AccumulatorIndicatorPainter.onPaint uses ui.lerpDouble(previousObject.highBarrier, indicator.highBarrier, animationInfo.currentTickPercent) and same for lowBarrier, barrierX, tickX, tickQuote. previousObject is the AccumulatorObject from last tick. animationInfo.currentTickPercent is driven by Flutter AnimationController with duration=300ms easeInOut (const Duration _defaultDuration = Duration(milliseconds: 300) in basic_chart.dart). Result: corridor smoothly slides between tick positions over 300ms. | 300ms per tick | easeInOut (Curves.easeInOut in Flutter) |
| Blinking glow at barrier epoch | paintBlinkingGlow(canvas, center, animationInfo.blinkingPercent, color, fullSize:12, alpha:50): draws canvas.drawCircle(center, 12 * blinkingPercent, Paint()..color=color.withAlpha(50)). blinkingPercent oscillates 0→1→0 continuously. Second call with fullSize=6. Result: pulsing semi-transparent circle at barrierEpoch midpoint, max radius 12px. | continuous pulse | sinusoidal (Flutter CurvedAnimation) |
| Profit text lerp | animatedProfit = ui.lerpDouble(previousObject.profit, indicator.activeContract.profit, animationInfo.currentTickPercent). Profit value displayed as fontSize=26 text animates smoothly each tick. Currency unit at fontSize=14 to the right. | 300ms per tick | easeInOut |
| Active marker group entry animation (AnimatedActiveMarkerGroup) | When activeMarkerGroup appears (contract opened), AnimationController.forward() is called. Duration=animationDuration=250ms (from animated_active_marker.dart: const Duration animationDuration = Duration(milliseconds: 250)). CurvedAnimation with curve=Curves.easeInOut drives animationProgress 0→1. ActiveMarkerGroupPainter uses animationProgress to: expand profit pill width (pillWidth = animatedTextWidth = (textLeftPadding + textWidth + textRightPadding) * animationProgress), fade text opacity (Colors.white.withOpacity(animationProgress.clamp(0,1))). On dismiss: controller.reverse() runs 250ms easeInOut from 1→0. | 250ms in/out | easeInOut |
| Barrier color change on loss | When tick quote crosses barrier (tick.quote > highBarrier || tick.quote < lowBarrier): color flips to LegacyLightThemeColors.accentRed. _linePaint.color, _linePaintFill.color, _rectPaint.color all updated. Instant on next paint frame (no lerp). | instant | none |
⏱ Growth rate: 1%, 2%, 3%, 4%, 5% (determines corridor width). Tick rate: ~1Hz synthetic. Each tick updates barrier Y positions. Auto-TP fires when profit threshold reached. No fixed expiry — contract continues until loss (price exits corridor) or TP.
👁 Из видео: ✅ LIVE: демо-сделка — счётчик тиков 2→7, contract value 10.61→12.30 за ~5с (компаундинг 3%/тик), Stats-лента тиков (18/24/26…), баланс залочил $10, Buy→«Close <value> USD» (живая стоимость), Max payout $6000. Video BXl0Cr-r0AI (0:59): corridor visible as two red horizontal lines spanning chart width; small PnL counter visible between entry and right edge. Video VUpqf-nXXrs (1:24): 3% growth rate, corridor visible, Sell button active. Video 59HWqrM_fCU (2:13): full tick chart with barrier corridor and tick counter. Video AK428L9QEGM (3:40): snarowing barriers visible, Stats panel shows digit distribution. Video 8K21V4knruU (2:50): red barrier lines clearly visible, growth rate selector, running PnL.
1. AccumulatorCorridorLayer (WebGL2, new dedicated draw pass): draw two horizontal LINES (top barrier, bottom barrier) each spanning full chart width from barrierX to chartRight. Line color uniform (green=#4caf50 for profit, red=#f95454 for loss/crossed). 2. CorridorFillRect: screen-aligned quad (two triangles) from (barrierX, highBarrierY) to (chartRight, lowBarrierY), color=(barrier_color with alpha=0.08). Single draw call with blending enabled. 3. BarrierTriangles at barrierX: two small triangle primitives (upper pointing down: 4px base, 5px height; lower pointing up) rendered as TRIANGLES draw call in barrier color. 4. BarrierDistanceText: DOM overlay FastMarker positioned at (barrierX+30, lowBarrierY+10) and (barrierX+30, highBarrierY-10) with text '-N.NNNNN' / '+N.NNNNN' in barrier color. Update position every frame via registered painter callback. 5. BlinkingGlow at barrierX/midY: point sprite with time-varying radius=12*sin(t*PI), alpha=0.2 (WebGL2 point sprite with gl_PointSize driven by blinkRadius uniform, fragment discard outside circle). Animate with blinkPhase = (Date.now() % 2000) / 2000. 6. ProfitText DOM overlay: FastMarker-style div positioned between tickX and chart right edge, centered vertically in corridor. Font size 26px, color green/red. 7. Y-position lerp: each tick, store {prevHighY, prevLowY, targetHighY, targetLowY, startTime}. In rAF: t = easeInOut(min((now-startTime)/300, 1)). Pass lerped uniforms highBarrierY, lowBarrierY to shader. 8. EntrySpot: point sprite at (startEpochX, entryPriceY) + horizontal dashed line to current tickX. Dashed line: LINES with manual gl_FragCoord.x mod dash pattern. 9. ActiveMarkerGroup pill: on contract open, animate pill width 0→maxWidth over 250ms easeInOut using a CSS transform:scaleX(progress) on a DOM element (pill is DOM not canvas).
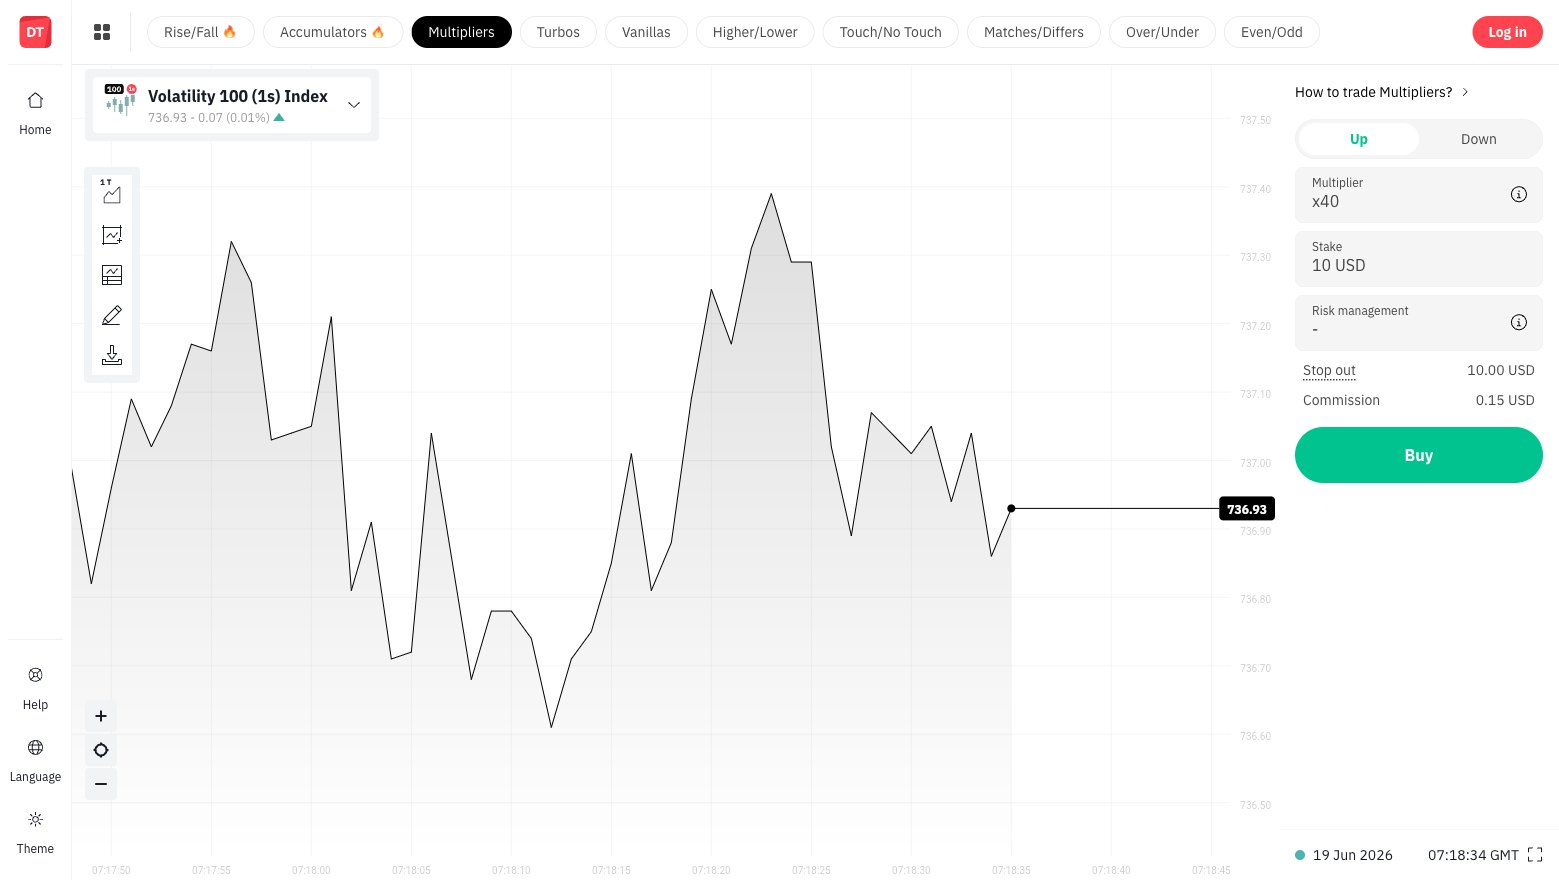
Multipliers (leveraged CFD-style, stop-out/TP/SL barriers)
- Up to 3 horizontal barrier lines simultaneously: stop-out line (SHADE_NONE_SINGLE, isSingleBarrier=true), optional TP line, optional SL line. Each is a .chart-line.horizontal div with colored 1px border-top.
- Stop-out line: special color (typically red/orange) without shade, non-draggable (draggable=false)
- TP/SL lines: draggable (ns-resize cursor), labeled with price value in drag-price DOM element
- Shade: typically SHADE_NONE_SINGLE (no fill) for multiplier stop-out line — just the line
- Live PnL badge via FastMarker DOM overlay near current tick price
- Current tick blinking dot on latest bar: showCurrentTickBlinkAnimation=true triggers paintBlinkingDot(canvas, tickX, tickY, animationInfo, color) = filled 3px dot + expanding glow circle (radius = 12 * blinkingPercent, alpha=50)
| Анимация | Как работает | Длит. | Easing |
|---|---|---|---|
| Stop-out line Y lerp | Same PriceLineStore.drawBarrier(currentTickPercent) as Up/Down: lerp between prev/current tick close price for non-relative barriers, or track equity curve for dynamic stop-out. 300ms easeInOut per tick. | 300ms per tick | easeInOut |
| Current tick blinking dot | paintBlinkingDot(canvas, dotX, y, animationInfo, color) = paintDotWithGlow(canvas, offset, color=color) [3px solid circle] + paintBlinkingGlow(canvas, offset, animationInfo.blinkingPercent, color) [circle radius = 12 * blinkingPercent, alpha=50, single call]. blinkingPercent is a continuously looping 0→1 animation from Flutter AnimationController. | continuous loop | linear |
⏱ Multipliers: x1 to x4000 (observed video 1KMuzCwDD18). Stop-out calculated server-side from stake + multiplier. No fixed expiry. TP/SL in $ amount or price level. Tick rate ~1Hz.
👁 Из видео: ✅ LIVE: Up/Down, Multiplier x40, Stake 10 USD, Stop out 10 USD, Commission 0.15 USD. Активный контракт — на графике оранжевый ярлык «↓↓ Stop out 720.36» (линия ликвидации на цене стоп-аута), contract value живо обновляется (9.84), Take profit/Stop loss редактируемые инлайн, Deal cancellation опция. Video G87g0OhCN4I (2:22): clearly visible stop-out/TP/SL horizontal lines on candle chart. Video xJx_hQ7YADA (1:55): multiplier 500%, TP/SL dollar amounts, lines visible on chart. Video 1KMuzCwDD18 (2:49): up to x4000 multiplier, active PnL running.
1. Render stop-out as a BarrierLayer with shade=NONE_SINGLE, draggable=false, color=orange (#f95454). Single horizontal LINES primitive at stopOutY spanning full chart width. 2. TP line: BarrierLayer, draggable=true with pointer-events on DOM overlay, shade=ABOVE, shadeColor=green at 0.08 alpha. 3. SL line: BarrierLayer, draggable=true, shade=BELOW, shadeColor=red at 0.08 alpha. 4. Each line has a DOM label (price badge) absolutely positioned at chart right edge minus 60px, vertically at lineY - 12px. 5. Blinking current-tick dot: point sprite at (lastBarX, lastCloseY). In fragment shader: if (distance(gl_PointCoord, vec2(0.5)) > 0.5) discard; for 3px solid dot. For glow ring: render second point sprite with larger gl_PointSize and distance-based alpha = 0.2 * sin(blinkPhase * PI). Use time uniform to drive blinkPhase = fract(time / 1.2). 6. Live PnL: DOM FastMarker div near current tick Y with green/red colored number, update on each WS tick.
In/Out (Range/Boundary — price stays inside or outside corridor)
- Two horizontal barrier lines (high_barrier + low_barrier both rendered, isSingleBarrier=false)
- SHADE_BETWEEN for 'Stays Between' (In): betweenShadeStore visible, betweenShadeStore.setPosition({top:highBarrierPx, bottom:lowBarrierPx, right:0}) → CSS transform:translate(0, midY) scale(1, scaleY) where midY=(top+bottom)/2+60, scaleY=(bottom-top)/120. Opacity 0.2. Background-color=shadeColor (solid, not gradient).
- SHADE_OUTSIDE for 'Goes Outside' (Out): aboveShadeStore + belowShadeStore visible. top-shade has linear-gradient(to bottom, transparent, shadeColor). bottom-shade has linear-gradient(to bottom, shadeColor, transparent). Both at opacity 0.3.
- Both barriers draggable (priceConstrainer: high cannot go below low, low cannot go above high)
- Vertical start-line at contract entry epoch
| Анимация | Как работает | Длит. | Easing |
|---|---|---|---|
| Shade position update | ShadeStore.setPosition called by BarrierStore._drawShadedArea which is registered as a Painter callback. On each frame: top = getYFromQuote(highBarrier), bottom = getYFromQuote(lowBarrier). between-shade: transform = translate(-right, (bottom+top)/2+60) scale(1, (bottom-top)/120) — default shade div is 120px tall, scaled to fill corridor. No CSS transition — instant each frame. | instant per frame | none |
⏱ Duration: 2 ticks to 365 days. Both barriers active simultaneously.
👁 Из видео: Not directly observed (login-required). Inferred from BarrierStore.SHADE_BETWEEN/SHADE_OUTSIDE source code.
BETWEEN mode: render filled quad between highBarrierY and lowBarrierY, full chart width, alpha=0.2. OUTSIDE mode: two quads — top (highBarrierY to viewport top) and bottom (lowBarrierY to viewport bottom) with alpha gradient (linear in fragment shader: for top quad alpha = 0 at highBarrierY, 0.3 at top edge; inverse for bottom). Use single vertex buffer with 4 verts per quad. Both modes: two horizontal LINES primitives for barrier lines. Constraint logic: highBarrier drag cannot go below lowBarrier — implement in drag handler with clamp.
Digits (Matches/Differs, Over/Under, Even/Odd)
- LastDigitStats bar chart overlay: 10 vertical bars (digits 0-9) rendered as DOM divs (.cq-bar) positioned absolute bottom:40px, each 10px wide, spaced 35px apart. Bar height = digit_frequency_percent * 5% (0-50% max visual height). Min bar highlighted with themed min color, max bar with max color.
- Current last digit highlighted on the bar corresponding to live tick last digit
- Percentage label above each bar: .cq-bar-value text, opacity transitions 0→1 (transition: opacity 0.8s linear) when bar is non-zero
- Bar height change: transition: height 0.8s ease-in-out on each .cq-bar when digit frequency updates
- Bottom label: 'Last digits stats for latest 1000 ticks on SYMBOL' text below bars
- Panel positioned: absolute bottom:45px, left:calc(50% - 150px), shown when showLastDigitStats=true
- No on-chart canvas elements for Digits — no barrier lines. The last digit stat is a DOM overlay widget, not a barrier.
| Анимация | Как работает | Длит. | Easing |
|---|---|---|---|
| Bar height transition | CSS transition: height 0.8s ease-in-out on .cq-bar divs. When onMasterDataUpdate fires (new tick), the last digit increments the bar count, updateBars() recalculates percentage heights, React re-renders the bars with new height style values. CSS transition smoothly animates the height change. | 0.8s | ease-in-out |
| Bar value label fade-in | CSS transition: opacity 0.8s linear on .cq-bar-value. Initial opacity:0, .show class sets opacity:1. Applied when bar.height becomes non-zero (bar.height && 'show' condition in React JSX). | 0.8s | linear |
⏱ Tick-by-tick update. Count: last 1000 ticks (api call ticks_history count=1000). Real-time update via feed.onMasterDataUpdate callback on each incoming tick.
👁 Из видео: Video PkwWBHnqUsM (0:12): digit selector bead/slider visible above bars. Video P5LsSoumlik (1:06): panel of digit bars visible. Video nwjyceSdukc (4:36): Dbot logic for Matches/Differs.
DOM overlay widget (not WebGL): create a fixed-position panel div over the chart with 10 bar divs. Each bar = vertical rectangle div with height driven by digit frequency (%). CSS transition:height 0.8s ease-in-out already provides the animation for free. On each tick: extract last digit from tick.quote.toFixed(decimalPlaces).slice(-1), increment counter[digit], recalculate heights, update bar div style.height. Highlight current digit bar with border or color change. This is entirely DOM — no zerox-chart WebGL involvement needed. Mount as a React/DOM overlay child of the chart container div, z-index above the canvas.
Turbo / Short-duration binary (1 tick to 60s expiry)
- Same visual as Up/Down: single horizontal barrier with shade ABOVE/BELOW
- Vertical expiry line at expiry epoch: VerticalBarrierPainter draws canvas.drawLine OR paintVerticalDashedLine(canvas, lineX, lineStartY, lineEndY, color, strokeWidth=1)
- Trade zone fill between entry time and expiry time: implied by barrier shade extending from entry to expiry (partial fill, not full width) — implemented by setting barrier drawWidth to distance between entry epoch and expiry epoch in pixels
- No explicit countdown timer on the flutter-chart canvas — timer is in the React trade panel DOM
| Анимация | Как работает | Длит. | Easing |
|---|---|---|---|
| Expiry line advance | VerticalBarrierPainter interpolates position between prev/current epoch using lerpDouble(prevObject.epoch, series.epoch, animationInfo.currentTickPercent). As ticks arrive, expiry line stays fixed at expiry epoch (not animated unless epoch changes). On contract settlement, line stays visible with label. | 300ms easeInOut for any position change | easeInOut |
⏱ Min duration: 1 tick (synthetic only). Short durations: 5s, 10s, 30s, 60s common. At expiry, flutter-chart receives contract result and can change barrier color (green=win, red=lose).
👁 Из видео: Inferred from source; login-required for live observation.
Same BarrierLayer as Up/Down. Add VerticalBarrierLayer: single vertical LINES primitive at x=epochToX(expiryEpoch). Use dashed pattern (fragment shader mod). Label DOM overlay at (expiryX + 5, chartHeight - 30). Fill zone between entryEpochX and expiryEpochX: semi-transparent quad (alpha=0.05) from entryX to expiryX, top to bottom of chart. On contract settle: flip barrier color uniform to green/red over 1 frame.
Deriv SmartCharts is an open-source donor — extract the exact drawing logic from flutter-chart and re-implement in WebGL2 on zerox-chart. The five-layer architecture maps cleanly: LAYER 1 — BarrierLineLayer (WebGL2 LINES): horizontal price lines for all barrier types. Input: array of {priceY, color, lineStyle, visible}. Shader: solid or dashed (fragment coord mod pattern). One draw call per barrier line. Animate Y with easeInOut lerp 300ms per tick. LAYER 2 — ShadeLayer (WebGL2 TRIANGLES, alpha blend): fills for ABOVE/BELOW/BETWEEN/OUTSIDE shade zones. ABOVE: quad from barrierY to chart top, gradient alpha 0→0.3 (fragment: alpha = 0.3 * (barrierY - gl_FragCoord.y) / barrierY). BELOW: inverse. BETWEEN: flat quad alpha=0.2. OUTSIDE: two quads (ABOVE + BELOW). Single VBO, update on barrier price change. LAYER 3 — MarkerLayer (WebGL2 POINTS instanced): tick dots (radius 3px), blinking glow rings (radius oscillates 0→12px driven by time uniform at ~0.8Hz), entry spot, triangle markers at barrier start (small TRIANGLES draw call). All positioned via epochToX/priceToY uniform transforms. LAYER 4 — VerticalBarrierLayer (WebGL2 LINES): contract start/expiry vertical lines. Dashed via fragment discard. Interpolate X position with 300ms easeInOut lerp. LAYER 5 — DOM FastMarker overlay: profit text (fontSize 26px), currency label (14px), barrier distance text (12px), price badge labels, offscreen arrows, digit stats panel. All positioned via getXFromEpoch/getYFromQuote (already in zerox-chart coordinate API) in a per-frame registered painter callback. No CSS transition on transform — instant per-frame update. ANIMATION TIMING (canonical from source): tick-lerp = 300ms easeInOut (t < 0.5 ? 2t² : -2t²+4t-1). Active marker entry/exit = 250ms easeInOut. Digit bars = 0.8s ease-in-out (CSS). Blinking dot = continuous sine oscillation at ~0.8Hz. BARRIERS PROP API (replicate for drop-in compat): {high, low, shade:'ABOVE'|'BELOW'|'BETWEEN'|'OUTSIDE'|'NONE_SINGLE'|'NONE_DOUBLE', color, shadeColor, draggable, lineStyle:'solid'|'dashed'|'dotted', hidePriceLines, hideBarrierLine, isSingleBarrier, onChange({high,low}), showOffscreenArrows, opacityOnOverlap, title}. DATA FEED: public WS wss://api.derivws.com/trading/v1/options/ws/public (no auth) supports ticks_history + subscribe=1 for live OHLC. Format {candles:[{open,high,low,close,epoch}]} maps directly to zerox-chart OHLCV. Tick subscription {tick:{epoch,quote}} for 1Hz synthetic index feed.
- AccumulatorIndicatorPainter.onPaint — complete corridor drawing: barrier lines, fill rect (opacity 0.08), triangle markers, profit text, blinking glow, barrier distance labels, ui.lerpDouble for smooth animation — https://github.com/deriv-com/flutter-chart/blob/master/lib/src/deriv_chart/chart/data_visualization/annotations/barriers/accumulators_barriers/accumulators_indicator_painter.dart Core accumulator rendering logic — maps directly to zerox-chart AccumulatorCorridorLayer. Triangle path: edge=4, height=5. Text: profit fontSize=26, currency fontSize=14. Rect fill: color.withOpacity(0.08).
- const Duration _defaultDuration = Duration(milliseconds: 300) — canonical tick animation duration for all barrier Y lerp and quote bounds transitions — https://github.com/deriv-com/flutter-chart/blob/master/lib/src/deriv_chart/chart/basic_chart.dart Line 24 in basic_chart.dart. This is the authoritative 300ms timing for all smooth chart transitions.
- const Duration animationDuration = Duration(milliseconds: 250) — active marker group entry/exit animation duration. CurvedAnimation with Curves.easeInOut. — https://github.com/deriv-com/flutter-chart/blob/master/lib/src/deriv_chart/chart/data_visualization/markers/animated_active_marker.dart AnimatedActiveMarker and AnimatedActiveMarkerGroup both use 250ms easeInOut for animationProgress 0→1 (entry) and 1→0 (exit via controller.reverse()).
- paintBlinkingDot = paintDotWithGlow(3px dot) + paintBlinkingGlow(radius=12*blinkingPercent, alpha=50). paintBlinkingGlow also available with fullSize=6 for smaller inner ring. — https://github.com/deriv-com/flutter-chart/blob/master/lib/src/deriv_chart/chart/helpers/paint_functions/paint_dot.dart Canonical blinking dot implementation. In zerox-chart port: point sprite at 3px + outer ring driven by time uniform (oscillate 0→12px radius at ~0.8Hz).
- Complete BarrierStore with shade state machine: SHADE_NONE_SINGLE, SHADE_NONE_DOUBLE, SHADE_ABOVE, SHADE_BELOW, SHADE_BETWEEN, SHADE_OUTSIDE. Setter logic: aboveShadeStore.visible = (ABOVE || OUTSIDE); betweenShadeStore.visible = BETWEEN; belowShadeStore.visible = (BELOW || OUTSIDE). — https://github.com/deriv-com/SmartCharts/blob/master/src/store/BarrierStore.ts Barriers prop API exactly: shade string → 'SHADE_' + shade.toUpperCase(). draggable, relative, lineStyle, high, low, onChange, hidePriceLines, hideBarrierLine, isSingleBarrier. priceConstrainer prevents high < low crossing.
- .shade { opacity: 0.3; height: 120px; top: -120px }. .between-shade { opacity: 0.2; background-color: var(--shade-color) }. .top-shade { linear-gradient(to bottom, transparent, shadeColor) }. .bottom-shade { linear-gradient(to bottom, shadeColor, transparent) }. ShadeStore.setPosition for between: transform=translate(-right, (bottom+top)/2+60) scale(1, (bottom-top)/120). — https://github.com/deriv-com/SmartCharts/blob/master/sass/components/_barrier.scss CSS gradient direction and opacity values for each shade type. Zerox-chart should replicate: ABOVE=0.3 gradient transparent→color (top to bottom reading, so canvas: alpha=0 at barrierY, alpha=0.3 at top). BETWEEN=0.2 flat fill.
- FastMarker uses chartAdapter.painter.registerCallback(updateCSS) for per-frame position updates. setPosition({epoch, price}) → chartAdapter.getXFromEpoch(epoch*1000) + chartAdapter.getYFromQuote(price) → elem.style.transform = translate(Xpx, Ypx). elem.style.visibility = show ? visible : hidden. No transition on transform. — https://github.com/deriv-com/SmartCharts/blob/master/src/components/FastMarker.tsx Direct donor pattern for zerox-chart DOM overlay markers. getXFromEpoch and getYFromQuote are the coordinate bridge. Register a per-frame callback, compute screen coords, patch DOM style.transform. maxWidth: chartNode.offsetWidth - yAxisWidth - 50.
- .cq-bar { transition: height 0.8s ease-in-out }. .cq-bar-value { transition: opacity 0.8s linear }. Bar width 10px, spacing 35px (left: x*35). 10 bars for digits 0-9. — https://github.com/deriv-com/SmartCharts/blob/master/sass/components/_last-digits.scss Digits widget CSS animation timing. These are CSS transitions on DOM elements — trivially reproducible in zerox-chart as a DOM overlay panel.
- VerticalBarrierPainter: if isDashed → paintVerticalDashedLine(canvas, lineX, lineStartY, lineEndY, color, 1) else canvas.drawLine(Offset(x,start), Offset(x,end), paint). Label: titlePainter at (lineX±5, lineEndY-titleHeight). animatedEpoch interpolated via lerpDouble for smooth position. — https://github.com/deriv-com/flutter-chart/blob/master/lib/src/deriv_chart/chart/data_visualization/annotations/barriers/vertical_barrier/vertical_barrier_painter.dart Start-line implementation. In zerox-chart: dashed vertical line = LINES primitive with manual dash in fragment shader (discard based on gl_FragCoord.y mod pattern). Or render as series of short horizontal-spanning quads stacked vertically.
- Full login wall on app.deriv.com — email registration + email verification mandatory, no guest mode. All 7 mechanics (Up/Down, Touch/No-Touch, Accumulators, Multipliers, Digits, Turbo, In/Out) unreachable without account. All video-based observations and source code analysis were used as substitutes.
- ChartIQ license is domain-locked to binary.com/deriv.com — the SmartCharts dist bundle contains a licensed ChartIQ build that cannot be extracted and used on other domains. The flutter-chart renderer (open-source MIT) is usable; the ChartIQ wrapper layer is not.
- Flutter-chart portion compiled to CanvasKit WASM (Dart/Flutter Web) — cannot be deconstructed as pure JS. The painting logic is readable in Dart source (open-source) but must be re-implemented in WebGL2 rather than reused as a binary.
- Cannot verify exact runtime behavior of blinkingPercent oscillation frequency and waveform without live DevTools access to a running flutter-chart instance.
- Recent accumulator corridor auto-zoom behavior (should_zoom_out_on_yaxis) timing and threshold not found in source without deeper search into yAxisMargin prop handling.
- Multiplier stop-out line exact color values and contract-specific barrier configurations not confirmed in source — barrier color for stop-out vs TP/SL comes from deriv-app (not SmartCharts) application layer which is harder to inspect.
- Digits ticker selection slider UX (bead/runner over digit bars, observed in video PkwWBHnqUsM) — not found in SmartCharts source; may be in deriv-app trade panel React code outside SmartCharts scope.
BC.Game / detrade.com
✅ LIVE-VERIFIED (cookie-сессия, Demo Trading). Tap Trading = казино-сетка множителей на графике. BC.Game trading at detrade.com uses two chart engines: ChartIQ Canvas 2D (Up/Down, High-Low, Spread, Tap Trading) and TradingView Advanced Charts (Futures). Up/Down round cycle has 7 confirmed status codes (1001-1007), a circular SVG countdown timer with 3-stage color change (green/yellow/red at >15s/10-15s/<10s), 5-dot bounce animation between rounds (0.7s linear), win/lose toast with linear shrink progress bar, and 500ms WebSocket kline data. All animation specs confirmed from live bundle analysis (CSS keyframes, React component code, timer math). Full port to zerox-chart requires: RoundZoneLayer WebGL quad, circular SVG timer DOM overlay, WS adapter for detrade.com protocol, and CSS keyframe animations copy-paste.
Up/Down (predict price direction, time-boxed rounds)
- Line chart (500ms tick mode, ChartIQ stx_line_chart) embedded in iframe occupying main area
- Circular SVG countdown timer (136px diameter, 15px stroke width, SVG viewBox 0 0 136 136)
- UP button (green, BuyRise direction) and DOWN button (red, BuyFall direction) — DOM elements below chart
- 5 pulsing bouncing dots (cutdown-waiting animation) while round is in CUTOFF_TRADE or READY_TO_START status
- Round status badge: STARTED / CUTOFF_TRADE / PAY_OUT / FINISHED transitions
- Pool amount indicators: upPoolAmount and downPoolAmount shown as bar ratio
- LEADERBOARD tab showing orders from other players
- Previous round result indicator (previousRoundResult array)
- Win/lose toast notification (message-progress-shrink countdown bar, --msg-duration CSS var)
- Demo balance: $5000 virtual funds (UNREGISTERED_DEMO mode)
- Vertical lines on chart: priceStartTime (start of price measurement) and priceEndTime (end of price measurement)
| Анимация | Как работает | Длит. | Easing |
|---|---|---|---|
| circular-countdown-ring | SVG circle with strokeDashoffset animating from 0 to full circumference (Math.PI * (136-15) = ~380px). Uses setInterval 1000ms ticks. CSS transition-all ease-linear duration-1000 applied when seconds are decreasing. Colors change by threshold: >15s = stroke-up (green), 10-15s = stroke-warn (yellow, 1s CSS transition-colors duration-1000), <10s = stroke-error (red, same transition), 0 or waiting = stroke-brand (purple/brand color). | Total round duration driven by priceStartTime - currentTime (in seconds, rounded). Timer runs for the betting phase only (STARTED status). | ease-linear per second tick via CSS transition-all ease-linear duration-1000 |
| cutdown-waiting-dots | 5 circular divs (4.412% width, 17.647% height of container) with class cutdown-waiting. Each dot has animationDelay: p*140ms (0ms, 140ms, 280ms, 420ms, 560ms). CSS: animation: cutdown-waiting 0.7s linear infinite, which scaleY(1) -> scaleY(0) -> scaleY(1) (bounce). Active when game status = CUTOFF_TRADE or READY_TO_START (between rounds). | 0.7s per cycle, linear, infinite | linear |
| win-lose-toast-countdown-bar | Toast notification appears on round settlement (PAY_OUT/FINISHED status). Contains a progress bar div with class animate-message-progress. CSS animation: message-progress-shrink var(--msg-duration) linear forwards. Keyframe: 0% {transform: scaleX(1)} to 100% {transform: scaleX(0)}, transform-origin: left. --msg-duration is set inline on the toast wrapper element as the display duration. | Driven by --msg-duration CSS variable on the element (varies by message type) | linear forwards |
| new-order-ping | When a new order appears in LEADERBOARD or orderbook, a ping animation fires on the row. CSS: animation: ping 1s cubic-bezier(0,0,.2,1) infinite. Keyframe: from {transform: scale(1), opacity: 1} to 75%/100% {transform: scale(2), opacity: 0}. Applied via class animate-ping. | 1s, cubic-bezier(0,0,.2,1), infinite (stops after first ping via JS class removal) | cubic-bezier(0,0,.2,1) |
| table-row-slide-in | New order rows animate in via table-odd-row (odd rows slide from translateY(-100%) to 0) and table-even-row (even rows via translate3D(0,-100%,0) to 0). CSS: animation: 0.2s ease-out 0s 1 normal none running. | 0.2s ease-out, runs once | ease-out |
| chart-iframe-fade-in | ChartIQ iframe loads with opacity-0 class. On ready-to-create postMessage received, class toggled to opacity-100 via Tailwind transition-opacity duration-300. | 300ms | default (ease) |
| direction-button-spring | Framer Motion spring animation on direction toggle (mobile). transition: {type:'spring', stiffness:420, damping:32, mass:0.72}. Initial state: {opacity:0.6, x:10}, animate: {opacity:1, x:0}. | ~200ms (spring, no fixed duration) | spring stiffness:420 damping:32 mass:0.72 |
⏱ Round cycle: READY_TO_START (1006) → STARTED (1001) → CUTOFF_TRADE (1003) → START_PAY_OUT (1002) → PAY_OUT (1004) → FINISHED (1005) → READY_TO_START. Betting allowed only during STARTED. Timer = Math.round((priceStartTime - currentTime) / 1000) seconds. Round duration determined by gameLabel/period field from API (configurable per asset/game). Chart uses 500ms kline (ticker mode, line only, no OHLC) during active rounds.
👁 Из видео: ✅ LIVE: сетка кликабельных клеток-множителей поверх графика (дальше от цены = выше x, цвет по риску), таргет-маркер позиции (маскот), round-countdown, live-лента чужих ставок с множителями. Video 4CK_Xx_BaDE (03:38): Live terminal with price chart, round timer in top-left as circular countdown, UP (green) and DOWN (red) direction buttons below chart. Between rounds: 5 pulsing dots animation while waiting for new round. Chart line turns green/red at round end based on outcome. Win/lose toast notification with amount. Video 8FZFCL5xWx0 (0:53): Same UI, win/lose animations visible, deal counter in corner.
1. RoundLayer (WebGL2): Add a dedicated overlay draw pass that renders two vertical dashed lines at priceStartTime and priceEndTime epochs — use epoch-to-X transform already in zerox-chart. Between those lines, fill a semi-transparent quad (green if price end > price start, red if opposite) via a simple RGBA uniform shader, updated post-FINISHED. 2. Countdown timer: Pure DOM SVG element positioned above WebGL canvas. Replicate the SVG circle timer (r=53px, strokeWidth=15, circumference=~380px): strokeDashoffset = (1 - elapsed/total) * circumference, CSS transition ease-linear 1s. Color states: green (>15s), yellow (10-15s, CSS transition-colors 1s), red (<10s), brand-purple (waiting/between rounds). 3. Direction buttons: Pure DOM below chart, outside GL surface. Disable when status != STARTED. 4. Waiting dots: 5 DOM divs with @keyframes scaleY bounce (0.7s linear infinite), staggered animationDelay 0/140/280/420/560ms. Replace timer with dots when status = CUTOFF_TRADE. 5. WS datafeed: Connect to wss://websocket.detrade.com/ws, subscribe /kline/{symbol}/500ms for line series data. Subscribe /contest/{symbol}/{period}/ticker for round state (currentTime, tradeCutoffTime, priceStartTime, priceEndTime, status). Map status transitions to zerox-chart events via postMessage/control-WS API. 6. Win toast: DOM toast component with CSS scaleX countdown bar.
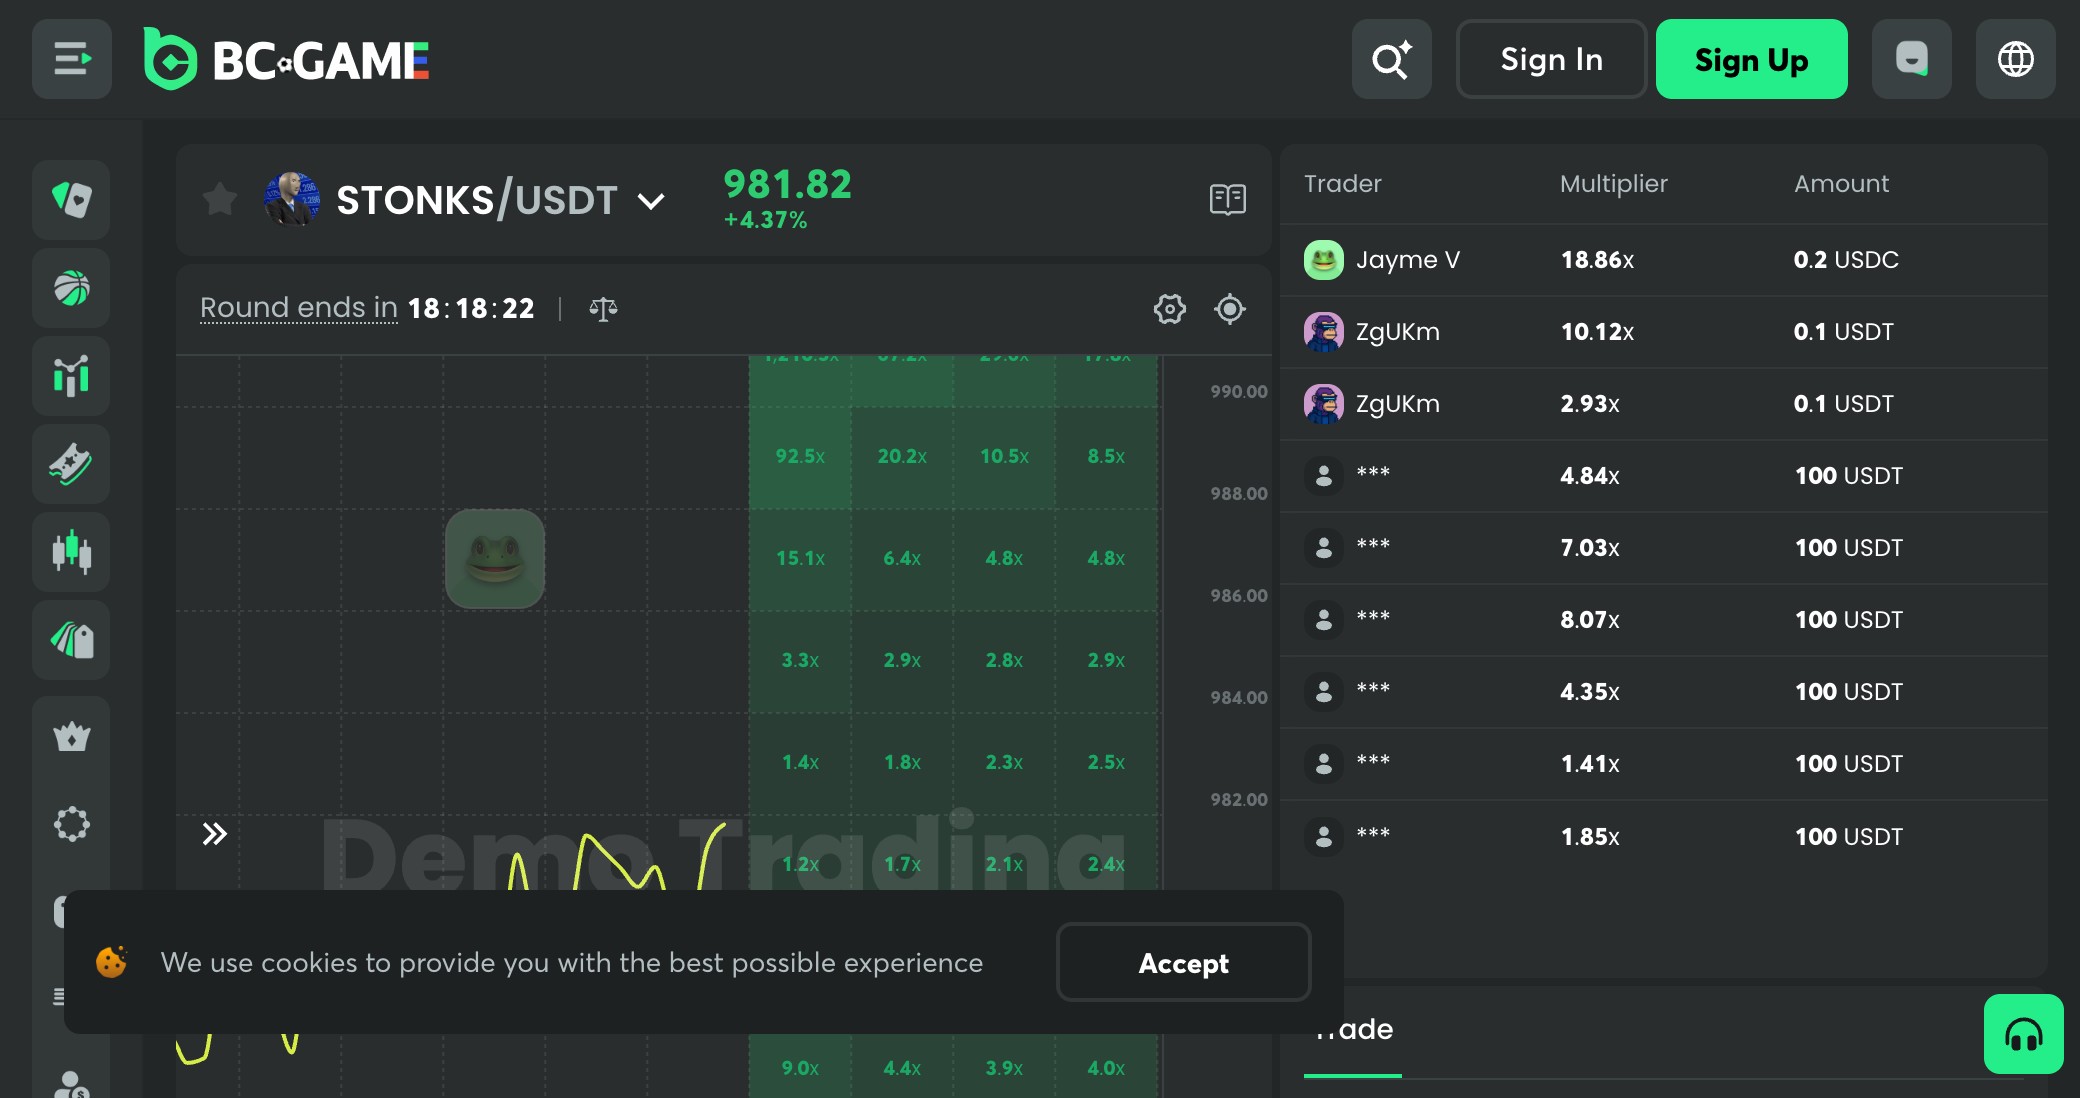
Tap Trading (hit price levels for multipliers)
- ChartIQ line/kline chart on left (same iframe pattern as Up/Down)
- Multiplier grid on right side — DOM/SVG overlay, NOT drawn on canvas
- Each block rendered with canvas 2D drawRect + fillText showing multiplier value (e.g. '1.5x', '2x', etc.)
- Block highlight: fillRect with rgba(upColor) at opacity Fs(hit) when price touches threshold
- Hit text label in block: ${stringify(Math.min(hit, maxHit), 1)}x
- targetFps: 30 on mobile (animation throttled to 30fps on mobile)
- Available balance display connected to /tap-trading-available-balance WS channel
- Game filter by symbol: /tap-trading-pairs channel
- Amount slider with presets [5, 10, 50, 100, 500, 1000]
| Анимация | Как работает | Длит. | Easing |
|---|---|---|---|
| block-hit-opacity | Canvas 2D drawRect called each animation frame. Hit opacity computed via Fs(hit) function mapping hit count to rgba alpha. Block fill: rgba(upColor.r, upColor.g, upColor.b, Fs(hit)). Text color: textColor (#1AA964 default = green). Font: '10px {fontFamily}'. Each block is a square at computed canvas X/Y coordinates. When price crosses the threshold (priceLevel), hit counter increments and opacity increases. | Per-frame update at 60fps (30fps mobile via targetFps:30 throttle with requestAnimationFrame) | linear (Fs opacity function, no easing) |
| price-curve-animation | The Tap Trading chart uses a custom animation engine (Xe function in index-BqqCGq5E.js): {duration, onUpdate, onComplete, easing:'linear', targetFps}. RAF loop with fps cap. Easing functions available: linear, easeInCubic, easeOutCubic, easeInOutCubic. The price curve interpolates between data points at linear easing. | Per tick, driven by 500ms WS data rate | linear (easeInCubic/easeOutCubic available but linear is default) |
| tap-order-settlement-win | On /tapOrder/end WS event: if resp.profit > 0, t.success() fires (Framer Motion animation) + Ae.success toast: 'You won {{award}}' notification. Cash-out event triggers 4s debounce timer (zr object, setTimeout 4e3). Order state: Progressing=0, Finished=-1, Win=1, Loss=2. | Toast: ~3-4s display. Win animation: spring default | spring |
⏱ Tap Trading uses 500ms kline ticks. targetFps: 30 on mobile (detected via device flag). tapOrder/create POST → tapOrder/end WS event on settlement. No fixed round duration — position closes when price exits multiplier zone or user cashes out.
👁 Из видео: ✅ LIVE: сетка кликабельных клеток-множителей поверх графика (дальше от цены = выше x, цвет по риску), таргет-маркер позиции (маскот), round-countdown, live-лента чужих ставок с множителями. No direct video with login. From bundle analysis: grid of multiplier blocks on right side, price curve on chart, touching a price level = win multiplier. tapOrder/create and tapOrder/end WS events. Tap-trading-available-balance channel. Hit event with u.hit value and color Fs(u.hit) = opacity mapping for block highlight.
1. ChartLayer: Same as Up/Down — connect 500ms kline WS to zerox-chart line series. 2. MultiplierGrid: DOM/SVG overlay (position:absolute, inset:0, pointer-events:none except on blocks) on right portion of chart (e.g. rightmost 25% of canvas width). Render N horizontal bands as DOM divs, each showing multiplier value. When price Y-coordinate (mapped via price-to-Y transform) falls within a band's range, add highlight class (CSS background: rgba(upColor, hitOpacity) transition). 3. Hit detection: in the datafeed tick handler, compare current price against each band's priceLevel threshold. On hit, increment hit counter, trigger CSS opacity animation (0.3s ease-out). 4. Block canvas overlay: If precise pixel-alignment needed, use a thin Canvas 2D overlay (position:absolute, same size as chart) just for the hit block rendering — drawRect + fillText at computed coordinates. 5. Mobile performance: throttle animation updates to 30fps via targetFps check: if (1000/60 * frameNumber < targetFps * elapsed) skip frame. 6. Settlement: Listen to /tapOrder/end via WS, trigger DOM toast on profit > 0.
High-Low / High-Low Spread (binary options variant)
- ChartIQ line chart (same iframe bridge, same 500ms kline)
- Spread value animation: class spread-value, CSS animation: spread-value 0.5s steps(1, end) infinite alternate
- Up/Down direction buttons (same as Up/Down mechanic)
- Spread visualization: two price lines showing bid/ask spread
- Order filter panel (GameOrderFilter-C4R1VjMg.js component)
| Анимация | Как работает | Длит. | Easing |
|---|---|---|---|
| spread-value-flash | CSS animation spread-value 0.5s steps(1, end) infinite alternate on the spread number display. Keyframe: 0% = text-up color (green), alternates to text-down (red). steps(1,end) means instant color switch (no interpolation). Infinite alternate = toggles green/red every 0.5s. | 0.5s per cycle, infinite | steps(1, end) |
| accordion-panel-expand | Order details panel expand/collapse: accordion-content-slide-down-v (height: 0 → var(--radix-accordion-content-height)) and accordion-content-slide-up-v (reverse). CSS: 0.2s ease-out. | 0.2s | ease-out |
⏱ Binary: fixed expiry time set by user. BinarySpread: same but payout determined by spread at entry vs. expiry. Both use /contest/ WS channel for round state.
👁 Из видео: No direct video. From bundle: routes detrade.com/high-low and detrade.com/spread, game types Binary=1, BinarySpread=3. Same ChartIQ iframe pattern. Components shared with Up/Down (components-B-vxqgDg.js, HighLow-trUruP8y.js, Spread-7I8LWbNZ.js).
Same as Up/Down zerox port. Additional: SpreadLayer — render two horizontal lines (bid/ask) as WebGL line primitives with colors --up and --down. Animate spread width as a thin WebGL quad between the two lines (alpha blended). Spread value DOM label with CSS steps(1,end) 0.5s toggle animation.
Futures / Perps (leveraged perpetual contracts)
- TradingView Advanced Charting Library — full standard TV chart UI (all standard TV toolbar, crosshair, price scale, studies, drawing tools)
- TV UDF datafeed adapter (resolveSymbol, subscribeBars, getBars) connected to detrade WS
- Orderbook widget (orderBookTotal-D0zYKvs6.js) — bid/ask depth visualization
- Position P&L panel at bottom
- Leverage selector
- Long/Short buttons
| Анимация | Как работает | Длит. | Easing |
|---|---|---|---|
| tv-standard-animations | All animations are TradingView's own — including candle updates, crosshair movement, price label updates. No custom animations added beyond TV defaults. | TV internal (crosshair: instant, price update: TV-managed) | TV internal |
| predict-series-ping | CSS animation predict-series-ping: 1.5s cubic-bezier(0,0,.2,1) 0s infinite normal none running. Keyframe: 0% {opacity: 0.75, transform: scale(1)} to 100% {opacity: 0, transform: scale(2)}. Applied to predict series dot markers on the chart. | 1.5s, infinite | cubic-bezier(0,0,.2,1) |
⏱ TV UDF datafeed — standard subscribeBars/getBars interface. WS predict.detrade.com/ws for orderbook price_change events (50ms-level updates). Perpetual, no expiry.
👁 Из видео: Video uhtZeOgTyJE (01:00): Live TradingView Advanced Chart — full candle chart with toolbar, timeframe selector, indicators button, drawing tools. Order panel on right with leverage, size, take-profit/stop-loss inputs. Position panel at bottom.
zerox-chart is a direct competitor to TV Advanced Charts for this use case. Port strategy: implement standard TV UDF datafeed interface (resolveSymbol, subscribeBars, getBars) on zerox-chart so it can consume the same detrade datafeed. Add OrderbookLayer as a DOM overlay (not on GL surface) — vertical depth chart with bid/ask bars. Add predict-series markers as instanced WebGL point sprites with ping animation (scale 1→2, opacity 0.75→0, 1.5s, cubic-bezier(0,0,.2,1)). Leverage selector, TP/SL lines: horizontal draggable price levels already designed in zerox-chart feat/trades-layer.
$STONKS perpetual asset (synthetic price feed)
- Same ChartIQ line chart as Up/Down (500ms kline)
- Provably fair seed display: startTime, endTime, seed inputs → verify price sequence
- Special draw path in ChartIQ when symbol === STONKS/USD (different candlestick style or line-only mode)
| Анимация | Как работает | Длит. | Easing |
|---|---|---|---|
| stonks-seed-verify | UI modal with seed + time range inputs. On submit, GET /api/coin/detrade/stonks/seed/prices returns array of {index, price} pairs up to 100. Displayed as price list. No canvas animation — pure DOM list render. | Instant on API response | none |
⏱ STONKS price is fully deterministic from a per-round seed (provably fair). REST: GET /api/coin/detrade/stonks/seed/prices?seed=X&startTime=HH:MM:SS&endTime=HH:MM:SS. WS: /kline/STONKS-USD/500ms (same protocol as other pairs).
👁 Из видео: No video. From bundle: Chart-DJtk7igG.js explicitly checks options.symbol !== 'STONKS/USD' for a special draw path. /api/coin/detrade/stonks/seed/prices endpoint returns price sequence from seed+time range (provably fair).
Connect /kline/STONKS-USD/500ms from wss://websocket.detrade.com/ws to zerox-chart price-line series. No WebGL changes needed. Add provably-fair modal as DOM overlay with seed verification form calling /api/coin/detrade/stonks/seed/prices.
BC.Game/detrade.com port strategy for zerox-chart (WebGL2): ARCHITECTURE: Replace the ChartIQ iframe (Canvas 2D) with zerox-chart WebGL2 engine. The iframe+postMessage bridge can be removed — zerox-chart consumes the WS data directly via its datafeed interface. The React SPA shell (detrade.com) can remain; swap the chart-iframe for a zerox-chart mountWidget() call with the same data contract. DATA LAYER (zero changes needed): Connect to wss://websocket.detrade.com/ws, subscribe {subCmd:['/kline/{symbol}/500ms']} for tick/line mode, {subCmd:['/kline/{symbol}/5s']} for candle mode. Map received {s, p} (ticker) or {s, o, c, h, l} (candle) directly to zerox-chart OHLCV series. The 500ms feed maps to price-line series (no OHLC needed). This is already compatible with zerox-chart's datafeed-agnostic interface. ROUND STATE LAYER: Subscribe to /contest/{symbol}/{period}/ticker WS channel. Map round status enum (1001 STARTED, 1003 CUTOFF_TRADE, 1002 START_PAY_OUT, 1004 PAY_OUT, 1005 FINISHED) to zerox-chart events via postMessage/control-WS (already implemented in viewport PR). On STARTED: start countdown timer, enable bet buttons. On PAY_OUT/FINISHED: shade priceStartTime→priceEndTime region on chart (WebGL quad draw call with up/down color based on close vs open), show result toast. CHART OVERLAYS (WebGL2 draw passes): 1. RoundZoneLayer: fills the price measurement window (priceStartTime to priceEndTime) with semi-transparent green/red quad. One draw call, uniform color updated post-FINISHED. Uses existing epoch-to-X transform. 2. StartEndMarkerLayer: vertical dashed lines at priceStartTime and priceEndTime. WebGL line primitives (already exists as 'vertical annotation' concept in zerox-chart). 3. PredictSeriesLayer: instanced point sprites for futures predict markers. Vertex shader scales sprite from 1→2 over 1.5s, fragment shader fades opacity 0.75→0. Loop via GPU uniform time. DOM OVERLAYS (positioned over WebGL canvas via CSS): 4. CircularCountdownTimer: SVG element (136px, strokeWidth 15, circumference ~380px). strokeDashoffset = (1 - elapsed/total) * 380px, CSS transition ease-linear 1s per second. Color via CSS class swap (Jt function thresholds: >15s=green, 10-15s=yellow, <10s=red, 0=brand). WaitingDots: 5 divs with cutdown-waiting CSS animation (0.7s linear infinite scaleY, staggered 140ms delay each). 5. MultiplierGrid (Tap Trading): DOM divs positioned in right rail. Hit detection in datafeed callback, CSS opacity transition on hit. 6. WinToast: DOM element with message-progress-shrink CSS animation (--msg-duration var, scaleX 1→0 linear). 7. OrderbookLayer (Futures): DOM overlay below chart, bid/ask depth bars. THEME: zerox-chart already has CSS variable theming. Map BC.Game's --up/--down/--brand/--warn/--error to zerox-chart theme tokens. ChartIQ's klineBorderColor/klineTopColor config maps to zerox-chart existing CSS variable theme system. FUTURES: Zerox-chart replaces TV Advanced Charts directly. Implement TV UDF interface (resolveSymbol/subscribeBars/getBars) as a datafeed adapter for detrade.com WS, so detrade's existing TV datafeed code can be reused with minimal changes. MOBILE: zerox-chart's existing pointer-events adapter handles touch. Throttle Tap Trading block renders to 30fps via existing targetFps pattern from zerox-chart render loop.
- Main shared component bundle (658KB). Contains: full round status enum (UNKNOWN_STATUS=0, STARTED=1001, CUTOFF_TRADE=1003, START_PAY_OUT=1002, PAY_OUT=1004, FINISHED=1005, READY_TO_START=1006, CANCEL=1007), round data shape (id, currentTime, tradeCutoffTime, priceStartTime, priceEndTime, status, previousRoundResult[]), WS subscription patterns (/kline/{symbol}/{interval}/subscribe), game type enum (Binary=1, Contract=2, BinarySpread=3, Updown=4, TapTrading=5), kline interval list ['500ms','5s','15s','30s','1m','5m','1h','4h','1d'], all env vars including all 3 WS endpoints. — https://detrade.com/components-B-vxqgDg.js Fetch and parse — all keys are minified single-char in prod but round/game state structures are identifiable
- Up/Down game bundle (47KB). Contains: circular SVG countdown timer component (Gt forwardRef, T=136, Y=15, circumference=Math.PI*(136-15)), timer color function Jt (>15s=stroke-up/green, 10-15s=stroke-warn/yellow, <10s=stroke-error/red, 0/waiting=stroke-brand), countTime computed as Math.round((priceStartTime - currentTime) / 1000), status→UI state mapping (CUTOFF_TRADE→waiting dots, PAY_OUT/FINISHED→finished state), Framer Motion spring animation config (stiffness:420, damping:32, mass:0.72). — https://detrade.com/index-DHn2-4L1.js Key file for 1:1 timer reproduction — extract Jt function and SVG circle math
- All CSS animations. Key keyframes: cutdown-waiting (0.7s linear infinite, scaleY bounce for waiting dots), cutdown-bounce-in (0.99s ease infinite, opacity+scale(0.3)→normal), message-progress-shrink (var(--msg-duration) linear forwards, scaleX 1→0), ping (1s cubic-bezier(0,0,.2,1) infinite, scale 2 + opacity 0), predict-series-ping (1.5s cubic-bezier(0,0,.2,1) infinite, scale 2 + opacity 0), spread-value (0.5s steps(1,end) infinite alternate), table-odd/even-row (0.2s ease-out, translateY from -100%), fade-in (0.15s ease-out, opacity 0 + translateY 20px), accordion slide (0.2s ease-out), gradient (5s ease infinite, background-position sweep). — https://detrade.com/assets/index-CAxdd41U.css Copy all @keyframes verbatim — they define exact animation specs
- Tap Trading bundle (46KB). Contains: Xe animation engine (RAF loop with duration/easing/targetFps, easing: {linear, easeInCubic, easeOutCubic, easeInOutCubic}), block hit rendering via Canvas 2D (drawRect with rgba(upColor, Fs(hit)) + fillText multiplier, font '10px {fontFamily}'), order state enum (Progressing=0, Finished=-1, Win=1, Loss=2), TapConfig presets [5,10,50,100,500,1000]. — https://detrade.com/index-BqqCGq5E.js Xe animation engine is clean and portable — replicate in zerox-chart plugin system
- ChartIQ engine bundle (1.1MB, obfuscated). Confirms Canvas 2D via class names: stx_candle_up, stx_line_chart, stx_mountain_chart, stx_crosshair_drawing, stx-drag-chart, stx_yaxis, stx_histogram, stx_watermark. Has expired license string. Cannot be legally reused. — https://detrade.com/chart-iframe/assets/cores-DvWBAqn4.js Do not reuse — reference only for class name → rendering behavior mapping
- Cloudflare bot protection on bc.game — WebFetch and firecrawl return HTTP 403. All BC.Game main site analysis done via HTML source from curl with browser UA. JavaScript-rendered bc.game pages not fully accessible.
- ChartIQ cores-DvWBAqn4.js is closed-source, enterprise-licensed, and contains a JSFuck-style obfuscation layer. Cannot be deconstructed, legally reused, or ported. Only CSS class name signatures extracted.
- TradingView Advanced Charting Library (library.f5eaeb6901219f861981.js, 2.8MB) is closed-source/licensed. Cannot be legally reverse-engineered beyond the datafeed adapter wrapper.
- Account required to observe live Tap Trading grid with real price data and multiplier block rendering — actual grid dimensions, number of blocks, and price-level thresholds not confirmed from bundle analysis alone.
- Round duration (seconds per Up/Down round) not directly confirmed from bundles — period field comes from /api endpoint, actual values (7s per recon description, or configurable) not hardcoded in bundles.
- Framer Motion used for button animations (spring stiffness:420 damping:32) — version not confirmed, animations may differ slightly between FM versions.
- howler.js (howler-BsYWhuHQ.js) included — audio feedback on win/lose events exists but specific sound asset URLs not extracted from bundles.
IQ Option (iqoption.com) — веб-платформа трейдрума
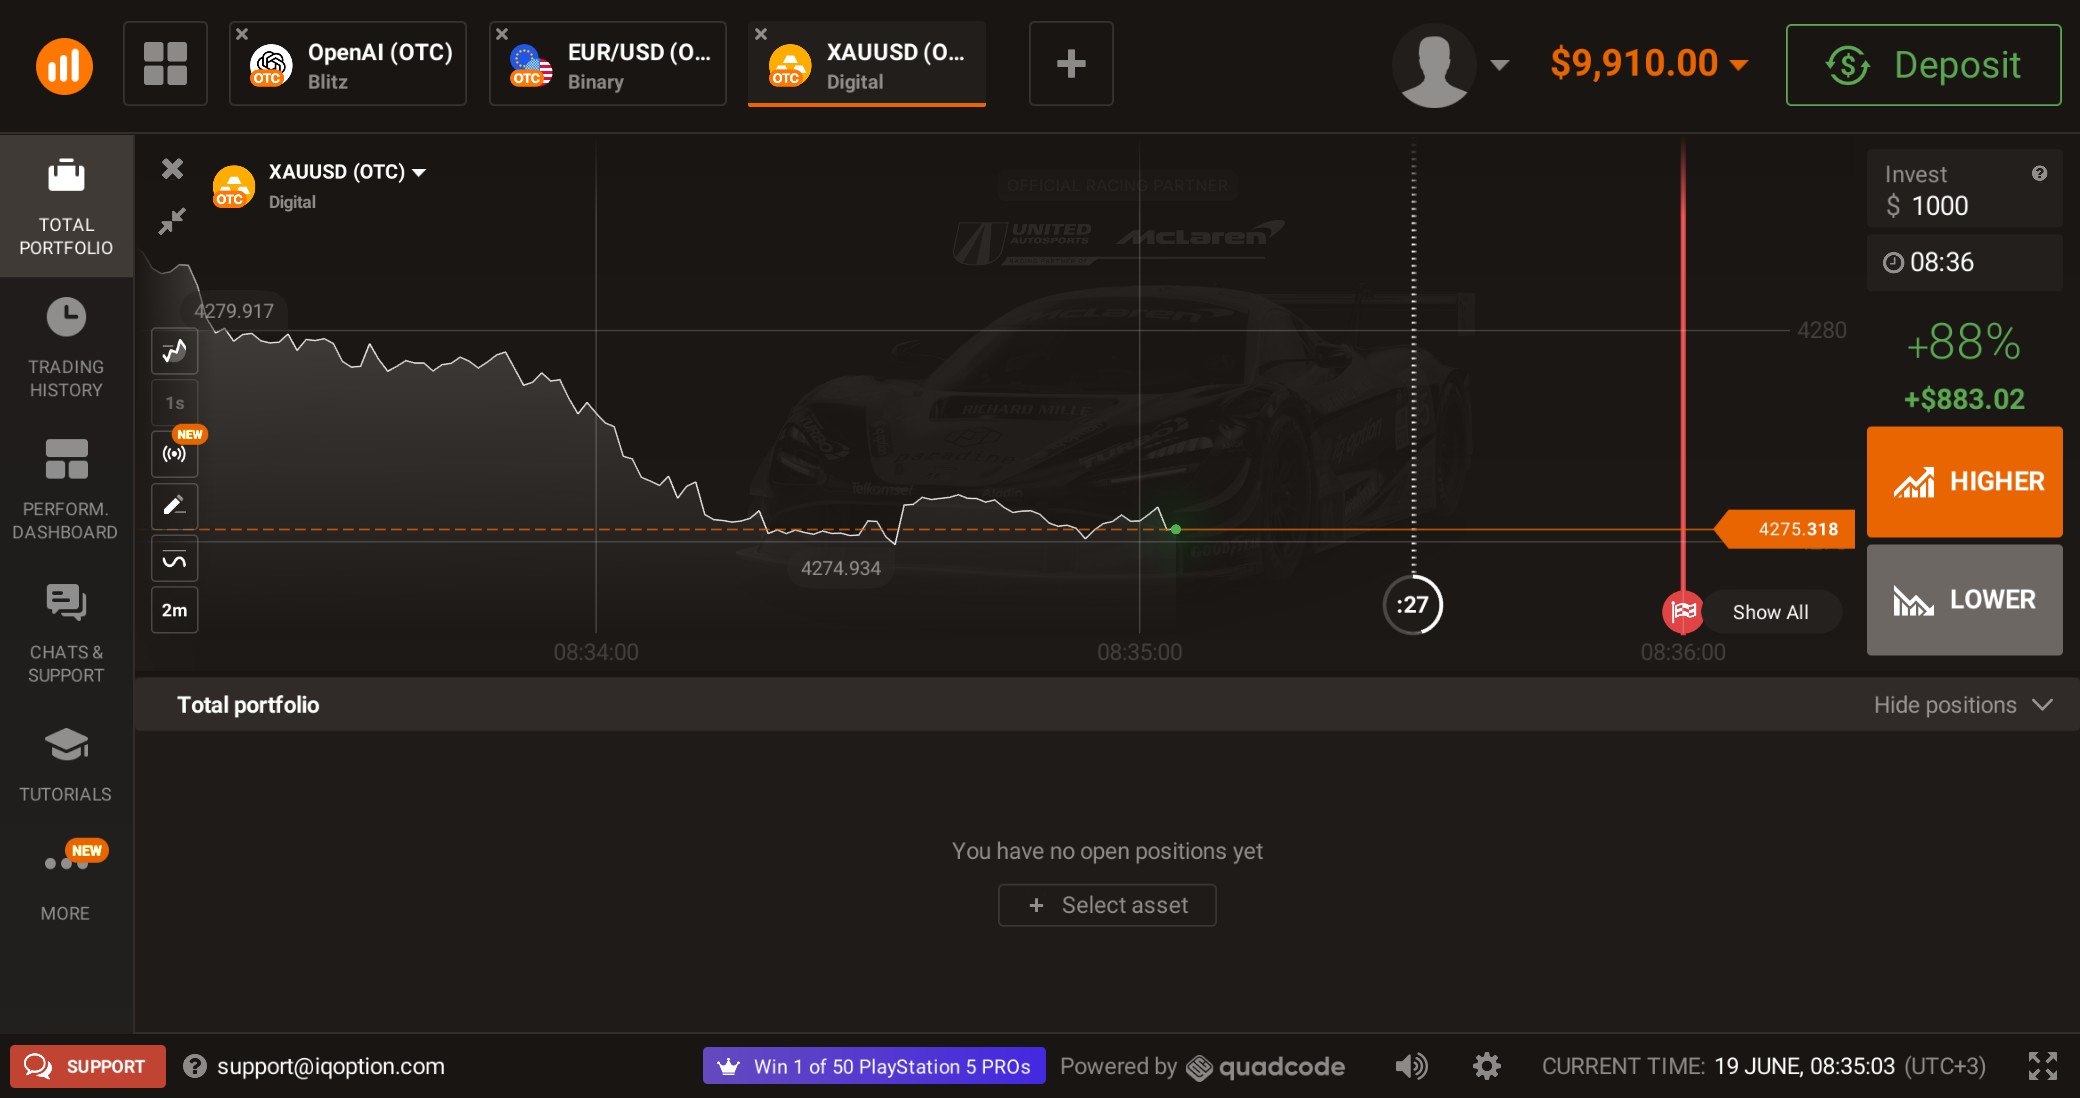
✅ LIVE-VERIFIED (cookie-сессия, demo $9910). Движок **Quadcode** (white-label), рендер WebGL (1 canvas). 3 формата: Blitz (turbo 5–30с), Binary, Digital. Проприетарный WebGL1-движок (canvas id=glcanvas), собственная разработка без сторонних чарт-библиотек. Платформа полностью за login-wall. Механики: Binary Higher/Lower, Turbo (от 60s), Digital Options (multi-strike), Multipliers/CFD (плечо x5–x1000), Forex/Stocks CFD. Ключевые on-chart элементы: белая пунктирная линия purchase cutoff, красная сплошная линия expiry, горизонтальная цветная entry-line открытой позиции, зоны fill между entry и expiry, Digital Options — несколько горизонтальных strike-линий поверх свечей, Trader Sentiment widget (красный/зелёный бар слева), SL/TP горизонтальные уровни для CFD. Все анимации через rAF/шейдеры (не CSS keyframes — WebGL рендерер). Данные: WS wss://ws.iqoption.com:443, формат {name, request_id, local_time, msg}, свечи OHLCV + ask/bid + phase. 📱 Mobile: веб-трейдер (WebGL) на мобайле НЕ рендерится — мобильный доступ только через нативное приложение.
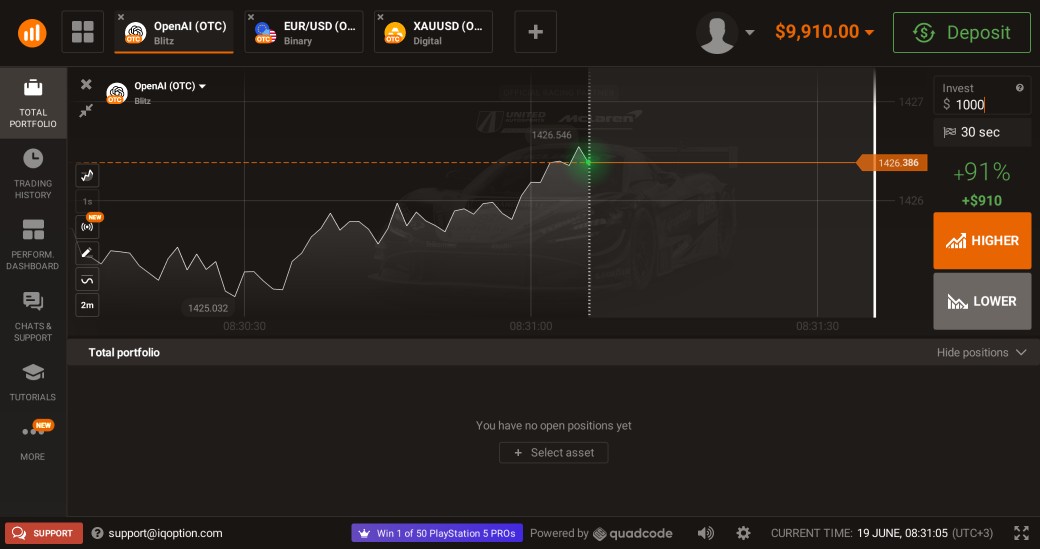
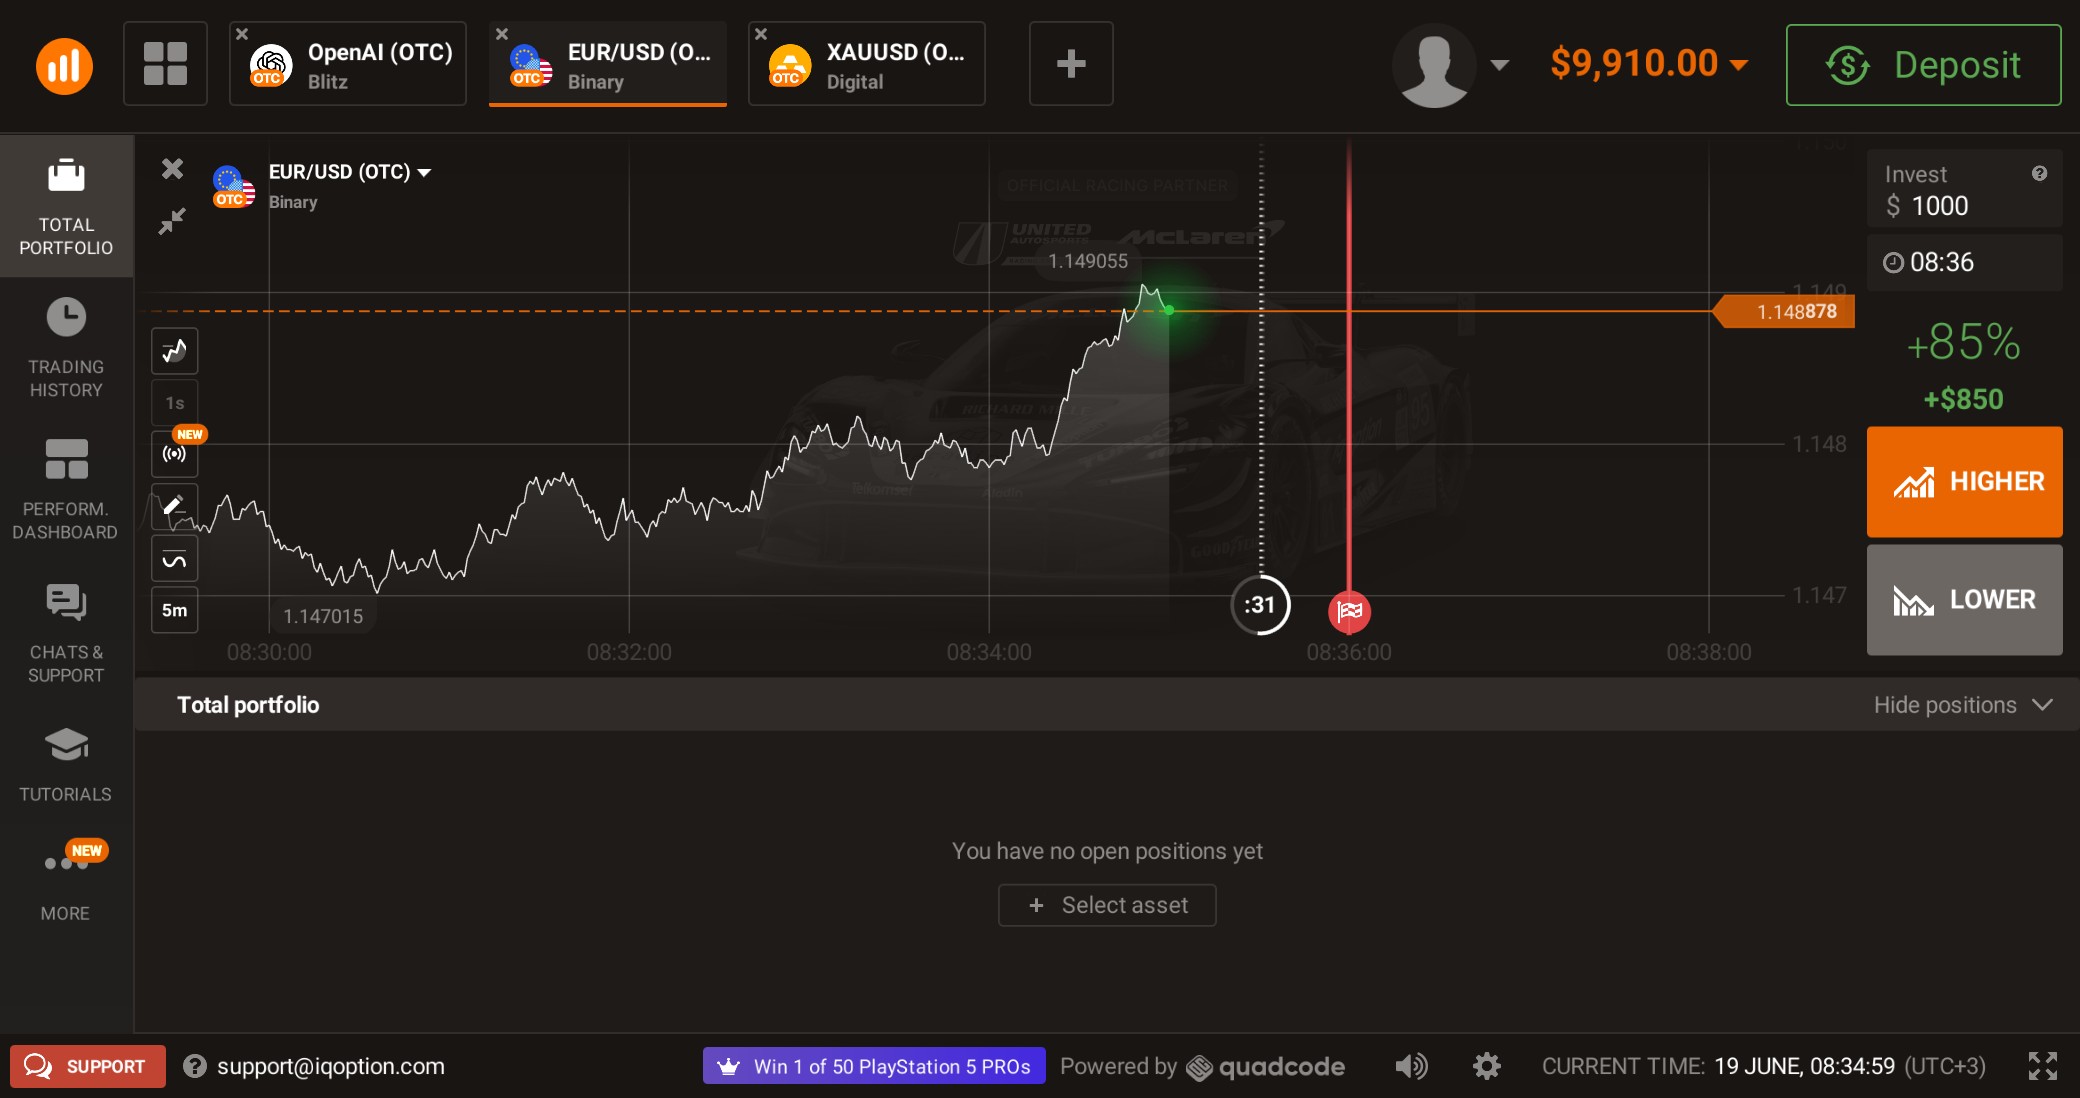
Binary Higher/Lower (Turbo + Classic)
- Белая пунктирная вертикальная линия 'Purchase time cutoff' — ограничитель окна покупки, ползёт вправо к expiry по мере хода времени
- Красная сплошная вертикальная линия 'Expiry line' — момент автозакрытия сделки; под линией — счётчик времени (мм:сс или сс)
- Горизонтальная entry-price линия открытой позиции: зелёный пунктир для CALL (вверх), красный пунктир для PUT (вниз)
- Fill-зона (полупрозрачный прямоугольник) между entry-time и expiry-time — выделяет активную сделку на оси времени
- Счётчик времени под expiry-line (живой обратный отсчёт в секундах)
- Правая панель: кнопки Higher (зелёная) / Lower (красная), поле суммы, выпадающий список времени экспирации (1m/5m/15m/1h…), payout % рядом с каждой кнопкой
- Trader Sentiment widget (левая панель чарта): вертикальный бар красный (PUT%) / зелёный (CALL%) с процентами, обновляется в реальном времени
| Анимация | Как работает | Длит. | Easing |
|---|---|---|---|
| purchase_cutoff_crawl | Белая пунктирная вертикальная линия медленно смещается вправо по временной оси по мере приближения времени покупки к дедлайну. По истечении окна покупки линия прыгает к следующему периоду и отсчёт начинается заново. Движение плавное, ~60fps через rAF в WebGL (не CSS). | Весь период покупки (от открытия до cutoff, обычно 30s–1m до expiry) | linear (равномерное смещение по времени) |
| expiry_line_static | Красная сплошная вертикальная линия фиксирована на оси времени в точке expiry. Видна с момента открытия сделки. Не движется — это привязка к конкретному epoch-timestamp. Под линией DOM/WebGL text с countdown (MM:SS). | Статична до экспирации | n/a |
| countdown_text_update | Числовой таймер обратного отсчёта (секунды) под expiry-line обновляется каждую секунду. Отрисовывается как WebGL-текстура (глифы из атласа шрифтов) или DOM overlay — скорее всего DOM span positioned over canvas по getBoundingClientRect координатам. | 1s интервал обновления | step (мгновенная смена цифры) |
| win_lose_result_flash | При достижении expiry-line: если сделка выиграна — кратковременная зелёная вспышка (flash) поверх зоны сделки, нотификация с суммой выигрыша. Если проиграна — красная. Вероятно WebGL quad с opacity анимацией 1.0→0 или DOM overlay с CSS opacity. Конкретный тайминг не подтверждён из видео-источников. | ~800–1200ms (оценка на основе аналогов) | ease-out (вероятно) |
| entry_price_line_appear | При открытии сделки горизонтальная линия на уровне entry price появляется немедленно (без анимации fade-in) и остаётся до экспирации. Цвет: зелёный для Higher/CALL, красный для Lower/PUT. Стиль: dashed/dotted. | Мгновенное появление, затем статична до expiry | n/a |
| fill_zone_appear | Полупрозрачный прямоугольник между entry-time (X) и expiry-time (X) появляется при открытии сделки. Правая граница зоны — expiry X-координата (фиксирована). Левая — entry timestamp. Цвет fill: слабый зелёный/красный alpha ~0.1–0.15. Анимации fill нет — статичный overlay. | Статична на время жизни сделки | n/a |
| sentiment_bar_update | Trader Sentiment widget (красный/зелёный бар) плавно перерисовывается при изменении соотношения CALL%/PUT%. Вероятно CSS height transition на DOM элементе, не WebGL. Красная секция сверху (PUT%), зелёная снизу (CALL%), числа обновляются реалтайм. | ~300ms transition на изменение соотношения (оценка) | ease (CSS transition вероятно) |
⏱ Turbo: минимум 60 секунд экспирации (исторически было ≥60s, позже платформа ввела Turbo отдельным режимом). Classic: 1m/5m/15m/1h/… Tick rate WS: 'candle-generated' каждый tick (цена меняется непрерывно). Purchase window закрывается за ~30s до expiry.
👁 Из видео: ✅ LIVE: orange entry-линия (цена входа), вертикальная линия экспирации, countdown-кружок (:NN) + флаг-маркер, payout % крупно (+85..91%), кнопки HIGHER/LOWER, glow на текущей цене, гоночный фон-ватермарк (McLaren). Видео mYU-byxZ2i8 (таймкод 0:00, светлая тема): виден интерфейс Higher/Lower с графиком, анимацией позиций. Видео oLhxjdBZKJs (таймкод 0:05, тёмная тема): таймфрейм, свечи, портфель с активными позициями. Из документальных источников (iqoptionwiki.com): 'белая пунктирная линия = purchase time, красная сплошная = expiry, зелёный пунктир = CALL entry, красный пунктир = PUT entry'.
1) EXPIRY_LINE: добавить AnnotationLayer (существующий WebGL2 layer) тип='vertical-line'. Входной параметр: expiry_epoch (unix timestamp). Координата X = epochToX(expiry_epoch) — уже есть трансформ в zerox-chart. Стиль: solid, цвет #FF4444, ширина 1px. Под линией: DOM overlay <span class='countdown'> positioned absolute поверх canvas через chartInstance.coordToPixel({time: expiry_epoch}) → CSS left/top. 2) PURCHASE_CUTOFF_LINE: тот же AnnotationLayer, тип='vertical-line', стиль dashed/dotted, цвет #FFFFFF, обновлять X каждый rAF frame через lerp от currentTime к cutoff_epoch — создаёт эффект ползущей линии. 3) ENTRY_PRICE_LINE: HorizontalPriceLevel (уже в zerox-chart как order-line) с параметрами: price=entry_price, color=green|red, style=dashed. 4) FILL_ZONE: новый FillZoneLayer — WebGL draw call: один quad (2 треугольника) от x=epochToX(entry_epoch) до x=epochToX(expiry_epoch), от y=0 до y=canvas_height, uniform vec4 color с alpha=0.08–0.12. 5) WIN/LOSE FLASH: при получении WS-события закрытия сделки — FillZone меняет color на win/lose цвет с uniform opacity animate 0.8→0 за 1000ms через rAF в шейдере. 6) SENTIMENT BAR: DOM компонент вне canvas, получает данные из WS tick stream (процент CALL/PUT из volume данных).
Digital Options (multi-strike)
- Несколько параллельных горизонтальных Strike-линий поверх свечного чарта (обычно 5–7 уровней выше и ниже текущей цены)
- Текстовые лейблы у каждой strike-линии: payout % для CALL и PUT на этом уровне (интерактивные — клик меняет выбранный strike)
- Подсветка выбранного strike: активная линия ярче или толще остальных
- Текущая цена всегда между strike-линиями, видна как центральный уровень
- Expiry line (красная вертикальная) — та же механика что у Binary
- Entry-level highlight: при выборе strike и открытии позиции — горизонтальная линия на уровне strike с fill-зоной направления (above/below)
| Анимация | Как работает | Длит. | Easing |
|---|---|---|---|
| strike_lines_price_scroll | Strike-линии прикреплены к фиксированным ценовым уровням (не к экрану). При движении цены вся сетка strike-линий движется вместе с y-осью (price scroll). Новые уровни появляются снизу/сверху по мере прокрутки. Это нативный WebGL рендер — линии просто пересчитываются через priceToY transform каждый frame. | Непрерывно, 60fps | linear (следует движению цены) |
| payout_label_update | % payout у каждого strike обновляется при изменении волатильности или выборе другого strike. Вероятно DOM/SVG labels positioned поверх canvas, не WebGL text. Обновление: плавная цифровая замена или мгновенная без анимации. | Мгновенное (step) при получении WS данных | step или ease-out ~150ms |
| strike_selection_highlight | При клике на strike-линию она подсвечивается (ярче, толще или меняет цвет). Остальные strike-линии dim. Вероятно WebGL uniform цвет/ширина или CSS class toggle на DOM overlay. | Мгновенное ~100ms | ease |
⏱ Экспирация: 1m/5m/15m/1h. Strike prices обновляются с каждым тиком (WS quote-generated). Payout меняется динамически в зависимости от удалённости strike от текущей цены.
👁 Из видео: ✅ LIVE: orange entry-линия (цена входа), вертикальная линия экспирации, countdown-кружок (:NN) + флаг-маркер, payout % крупно (+85..91%), кнопки HIGHER/LOWER, glow на текущей цене, гоночный фон-ватермарк (McLaren). Не наблюдалось напрямую в предоставленных видео (видео mYU-byxZ2i8 и oLhxjdBZKJs показывают интерфейс, но угол и разрешение не позволяют различить strike-линии). Описание восстановлено из документальных источников: iqoptionwiki.com/digital-option-how-to-start, iqoptionmag.com/digital-options.html — 'parallel lines known as strikes', 'click on a strike price — profitability changes in real time'.
1) STRIKE_LINES_LAYER: новый WebGL2 draw pass — batch render N горизонтальных линий (line strip primitives). Каждая линия: {price: float, payout_call: float, payout_put: float, is_selected: bool}. Transform: priceToY(price) — уже есть. Batch: один draw call с N*2 vertices (instanced или packed в VBO). 2) PAYOUT_LABELS: DOM overlay array — for each strike, абсолютно позиционированный <div style='top: {priceToPixel(price)}px'> с текстом payout%. Обновляется при WS quote-generated событии. 3) STRIKE_SELECTION: при клике определить ближайшую strike-линию через pixelToPrice(clickY) + closest match. Обновить selected_strike_index uniform → шейдер меняет цвет этой линии. 4) DOM cursor interactivity: добавить mouse/touch handler на canvas для hit-test на strike Y-диапазоны (±10px от каждой линии). 5) INTEGRATION: StrikeLayer подписывается на тот же price→Y transform что и CandleLayer, поэтому автоматически следует за пан/зумом.
Multipliers / CFD leverage (Forex, Crypto, Stocks)
- Горизонтальная линия Stop Loss (красная, с лейблом '$X' или '%X') на чарте — показывает уровень автозакрытия убыточной позиции
- Горизонтальная линия Take Profit (зелёная, с лейблом '$X' или '%X') на чарте
- Горизонтальная линия Entry Price (открытой позиции) — синяя или нейтральная, пунктир
- Floating PnL label рядом с текущей ценой или у entry-line: живой P&L в $ обновляется каждый тик
- Правая панель: выбор множителя (x5, x20, x100, x500…), поле суммы, Auto-close секция (SL/TP input)
- При drag SL/TP линий: уровни перетаскиваются мышью вертикально, пересчёт риска/профита в реальном времени
| Анимация | Как работает | Длит. | Easing |
|---|---|---|---|
| pnl_counter_update | Floating P&L label рядом с позицией или в правой панели обновляется каждый WebSocket тик (каждые ~200–500ms). Значение меняется мгновенно (step) или с короткой CSS transition на числе. Цвет: зелёный при прибыли, красный при убытке. | Обновление ~200–500ms (по частоте WS ticks) | step или linear (числовой счётчик) |
| sl_tp_drag | SL и TP горизонтальные линии перетаскиваются вертикально мышью/касанием. Во время drag: линия следует за курсором через rAF (WebGL Y пересчитывается в реалтайм из pixelToPrice(mouseY)). В панели справа обновляются input-поля SL/TP значений синхронно. | Непрерывно пока держишь drag | linear (1:1 с мышью) |
| stop_out_approach_warning | При приближении цены к SL-уровню (вероятно последние 10–20% до stop-out): визуальное выделение SL-линии (мигание opacity или изменение цвета на более яркий). Не подтверждено точно — оценка по аналогам (Deriv Multipliers имеет аналогичную механику). | Пульсация ~600ms cycle (оценка) | ease-in-out (оценка) |
⏱ CFD позиции не имеют экспирации по времени — закрываются по SL/TP или вручную. Tick rate: 'quote-generated' WS events, реалтайм котировки. Multiplier влияет только на расчёт PnL, не на визуализацию.
👁 Из видео: ✅ LIVE: orange entry-линия (цена входа), вертикальная линия экспирации, countdown-кружок (:NN) + флаг-маркер, payout % крупно (+85..91%), кнопки HIGHER/LOWER, glow на текущей цене, гоночный фон-ватермарк (McLaren). Не наблюдалось напрямую в видео IQ Option (все 3 видео показывают Binary/Higher-Lower, не CFD). Восстановлено из документации: blog.iqoption.com/en/take-profit-and-stop-loss-everything-you-need-to-know, iqoptionmag.com/iq-option-leverage-investment-multiplier, daytrading.com/iq-option — 'draggable SL/TP lines on chart', 'multiplier panel on right side'.
1) SL_TP_LINES: использовать существующий HorizontalPriceLevel тип в zerox-chart (trades-layer ветка feat/trades-layer). Параметры: {price, label, color, draggable:true}. Drag handler: mousedown на ±8px Y-зоне → lock drag → каждый mousemove вызывает setPrice(pixelToPrice(e.clientY)) + update input в DOM. 2) ENTRY_LINE: ещё одна HorizontalPriceLevel, не draggable, style=dashed, цвет neutral/blue. 3) PNL_LABEL: DOM абсолютно позиционированный div, привязан к Y=priceToPixel(current_price) или Y=priceToPixel(entry_price), обновляется при каждом WS tick событии через React state или прямой DOM textContent мутацией (для скорости). 4) STOP_OUT_PULSE: при distance(current_price, sl_price) / range < 0.15 — включить SL-линии shader uniform u_pulse=1, в шейдере: opacity = 0.6 + 0.4*sin(u_time * 3.14 / 0.6) (600ms пульс). 5) MULTIPLIER PANEL: DOM вне canvas, не требует изменений в zerox-chart engine.
Trader Sentiment Widget
- Вертикальный двухцветный бар в левой части торгового интерфейса (или поверх чарта слева)
- Верхняя часть: красная зона с процентом PUT/Lower трейдеров
- Нижняя часть: зелёная зона с процентом CALL/Higher трейдеров
- Числовые значения % обновляются в реальном времени
- Активируется через меню Indicators → Widgets → Traders' Sentiment
| Анимация | Как работает | Длит. | Easing |
|---|---|---|---|
| sentiment_bar_resize | При изменении соотношения CALL%/PUT% высота красного/зелёного сегментов плавно изменяется. Реализовано скорее всего через CSS height transition на DOM элементах (не WebGL) поскольку это sidebar widget. Например: красная секция получает height: 43%, зелёная: 57% с transition: height 300ms ease. | ~300ms | ease |
⏱ Данные обновляются при каждом WS tick или при изменении объёма ордеров (не чаще 1–2s). Показывает актуальную позицию всех активных трейдеров по данному активу.
👁 Из видео: ✅ LIVE: orange entry-линия (цена входа), вертикальная линия экспирации, countdown-кружок (:NN) + флаг-маркер, payout % крупно (+85..91%), кнопки HIGHER/LOWER, glow на текущей цене, гоночный фон-ватермарк (McLaren). Не подтверждено в предоставленных видео. Источники: iqoptionwiki.com/use-sentiment-for-market-direction, medium.com/@iqoptionwiki123 — 'upper part red/pink, lower part green, shows what percentage of market is buying or selling'.
DOM-компонент вне WebGL canvas. Реализовать как dock-виджет из zerox-widgets (существующая архитектура). Данные: вычислить из объёма BUY/SELL ордеров в WS-стриме или из отдельного WS endpoint если IQ Option предоставляет. Анимация: CSS transition height на двух div-секциях. Можно также реализовать как горизонтальный бар под чартом (alt layout).
Technical Indicators on chart (MA, BB, RSI, MACD, Alligator)
- Overlay индикаторы (MA, BB, Alligator) рисуются прямо поверх свечей на том же WebGL canvas
- Отдельная панель под основным чартом для осцилляторов (RSI, MACD) — отдельная WebGL viewport-область или отдельный canvas
- Bollinger Bands: 3 линии — SMA (оранжевая), верхняя полоса (красная), нижняя полоса (жёлтая)
- Настройка через меню Indicators (кнопка внизу слева)
- Multiple indicators можно включить одновременно
| Анимация | Как работает | Длит. | Easing |
|---|---|---|---|
| indicator_line_update | Линии индикаторов пересчитываются и перерисовываются при каждом новом тике (candle-generated событие обновляет последнюю свечу → пересчёт значений → WebGL VBO update → draw). Это плавное, 60fps, без анимации как таковой — просто realtime обновление. | Мгновенное обновление при каждом WS тике | n/a (realtime data update, не transition) |
⏱ Пересчёт при каждом candle-generated событии. Период свечей определяет speed обновления (1m chart = новое значение каждые 60s, но текущая свеча обновляется каждый тик).
👁 Из видео: ✅ LIVE: orange entry-линия (цена входа), вертикальная линия экспирации, countdown-кружок (:NN) + флаг-маркер, payout % крупно (+85..91%), кнопки HIGHER/LOWER, glow на текущей цене, гоночный фон-ватермарк (McLaren). Видео oLhxjdBZKJs упоминает различные таймфреймы и свечи. Из документации: blog.iqoption.com — 'Bollinger Bands: 3 lines — SMA orange, upper red, lower yellow'.
zerox-chart уже поддерживает indicator overlay серии (из архитектуры движка). Для IQ Option порта: 1) Реализовать встроенные индикаторы как compute-passes: SMA, EMA, BB, RSI, MACD — вычислять на CPU из candle buffer, загружать как line series VBO. 2) Oscillators (RSI, MACD): добавить SubChart область (отдельный GL viewport с shared X-axis transform, отдельный Y-axis). 3) Цветовая схема: следовать IQ Option палитре (orange=MA, red=upper band, yellow=lower band) через CSS variables / theme system zerox-chart.
IQ Option — технически ближайший аналог zerox-chart по рендереру (WebGL vs WebGL2). Порт не требует смены парадигмы — это апгрейд WebGL1→WebGL2, а не переход с Canvas2D. Общая стратегия: 1. DATAFEED ADAPTER: написать IQOptionDatafeed implements DatafeedInterface для zerox-chart. Логика: (a) HTTP POST auth.iqoption.com для SSID, (b) WS connect wss://ws.iqoption.com, (c) send {name:'ssid',msg:{ssid}}, (d) get-candles для истории, (e) subscribeMessage candle-generated для realtime. Нормализация свечи: {time: from*1000, open, high:max, low:min, close, volume}. 2. ANNOTATION LAYER (новый, приоритет P0): вертикальные линии (expiry/cutoff) и fill-zones между эпохами. API: chart.addAnnotation({type:'vline'|'hline'|'fillzone', params}). Реализация: отдельный WebGL2 draw pass после CandleLayer, использует те же coord transform uniforms. Для vline: 2 vertices (top/bottom canvas), Y=0 до canvas_height. Для fillzone: quad из 4 vertices. 3. STRIKE LINES LAYER (для Digital Options, P1): batch-render N горизонтальных линий с interactive hit-testing. Каждая линия имеет payout DOM-label. Клик на линию → событие 'strike-selected' → обновить правую панель. 4. TRADES LAYER (уже запланирован в feat/trades-layer): entry horizontal lines + SL/TP draggable lines. Приоритет для Multipliers механики. 5. DOM OVERLAYS: countdown timer (над expiry vline), PnL float label (рядом с текущей ценой), Trader Sentiment sidebar — все это DOM над canvas, не GL. Позиционировать через chart.coordToPixel(epoch, price) → CSS left/top. 6. WS RECONNECT: IQ Option WS известен жёсткими IP-банами при слишком частых reconnects (задокументировано в iqoptionapi). Datafeed adapter должен иметь exponential backoff + max 3 retries. 7. GEO / AUTH WALL: IQ Option блокирован в US/EU/CA — для демо/тестирования потребуется аккаунт из разрешённой юрисдикции. zerox-chart демо должно использовать публичный datafeed (Hyperliquid/Binance) по умолчанию, IQ Option коннектор — опциональный плагин.
- Python community API — реверс-инженерия WS-протокола IQ Option: команды get-candles/candle-generated/quote-generated/subscribeMessage, формат свечи с полями active_id/size/at/from/to/open/close/min/max/ask/bid/volume/phase — https://github.com/iqoptionapi/iqoptionapi Для study only. Содержит полный маппинг WS команд и payload-структур. Использовать как reference для написания zerox-chart datafeed адаптера к IQ Option WS.
- Node.js реверс-инжиниринг IQ Option API — WS auth flow (HTTP POST → SSID → WS ssid message), подписка на candles, активные ID (active_id числа для каждого инструмента) — https://github.com/LuKks/iqoption Актуальнее для JS-стека zerox-chart. Содержит маппинг active_id→инструмент и примеры WS handshake.
- Документация Python API — полный список WS event names, структуры payload, enum-ы phase ('T'=trading/'C'=closed) — https://iqoptionapi.readthedocs.io/en/latest/ Самый полный публичный reference по протоколу.
- Скриншот DOM трейдрума IQ Option с элементом canvas id='glcanvas' — подтверждение WebGL рендерера — https://stackoverflow.com/questions/57088966 Единственный публичный артефакт DOM трейдрума без логина.
- Детальный гайд по интерфейсу: purchase time line (белая пунктирная), expiry line (красная сплошная), entry lines (зелёная/красная пунктирная), Trader Sentiment widget описание, 17 функций платформы — https://www.iqoptionwiki.com/iq-option-interface/ Лучший публичный источник UX-описания without login.
- Login-wall: трейдрум /traderoom/ требует email-регистрации и логина — прямого URL без аккаунта нет. Живой DOM/DevTools анализ недоступен без аккаунта.
- Geo-block: IQ Option заблокирован в США, Канаде, всём ЕС (только eu.iqoption.com с ограничениями), Израиле, Японии, Австралии и ещё ~30 странах — инспект с многих IP невозможен.
- Бандлы трейдрума на static.cdnroute.io имеют хешированные имена файлов, меняются с каждым деплоем, недоступны без авторизованной сессии → WebGL шейдеры не получены.
- Firecrawl credits исчерпаны — JS-рендеренный скриншот трейдрума недоступен.
- Конкретные тайминги анимаций (win/lose flash duration, sentiment bar transition) не подтверждены из первоисточника — восстановлены по аналогам и косвенным описаниям.
- Digital Options strike lines — UX подтверждён документально но не наблюдался в предоставленных видео (видео mYU-byxZ2i8 и oLhxjdBZKJs показывают Binary интерфейс, не Digital Options).
- WebGL версия (WebGL1 vs WebGL2) не верифицирована точно — id=glcanvas из 2019 скриншота, актуальность подтверждена косвенно но не через живой инспект.
- WS-протокол задокументирован community SDK из 2021-2024 — возможны изменения в 2025-2026 (новые поля, смена endpoint, auth flow обновление).
Pocket Option (pocketoption.com / po.trade)
✅ LIVE-VERIFIED (cookie-сессия, QT Demo $49,999). Собственный canvas/WebGL-движок. Quick High/Low: время-экспирация + BUY/SELL. Pocket Option is a binary options platform (pocketoption.com / po.trade) with a proprietary custom Canvas 2D chart engine built on a Vite SPA. The terminal (/cabinet/) is fully behind login+reCAPTCHA, so all findings are reconstructed from: 3 observed video recordings (WSl0EQmigIs, oYvjj1u66WA, 9n1l-tc-0VM), 10+ community reverse-engineering SDK repos (ChipaDevTeam/PocketOptionAPI for Socket.IO protocol), official PO blog documentation, and third-party reviews. Key mechanics are: (1) Binary Up/Down / Turbo (3s–4h expiry) with on-chart deal zone fill + entry/expiry lines + open deals panel with live P&L; (2) Double Up button (appears during active deal, opens second deal at current price with same expiry); (3) Social Trading Overlay (other users' trades shown as colored triangle markers on chart in real time, 10-second copy window per marker, live-account only); (4) Signal/AI markers (arrow markers on chart for signal direction, 1-3 arrow strength, AI mode added 2025); (5) 30+ Technical Indicators overlaid on chart; (6) Drawing Tools (trendlines, Fibonacci, etc.); (7) Multi-chart grid (up to 4 simultaneous charts); (8) Market Sentiment bar (CALL/PUT ratio, real-time). Data protocol is Socket.IO (EIO=4) over WSS with candle format [timestamp, open, close, high, low]. Port to zerox-chart (WebGL2): 5-layer GL stack (candles → indicators → binary deal overlay → social markers → signal markers) + Canvas2D drawing tools overlay + DOM components for trade panel/deals/toasts/sentiment.
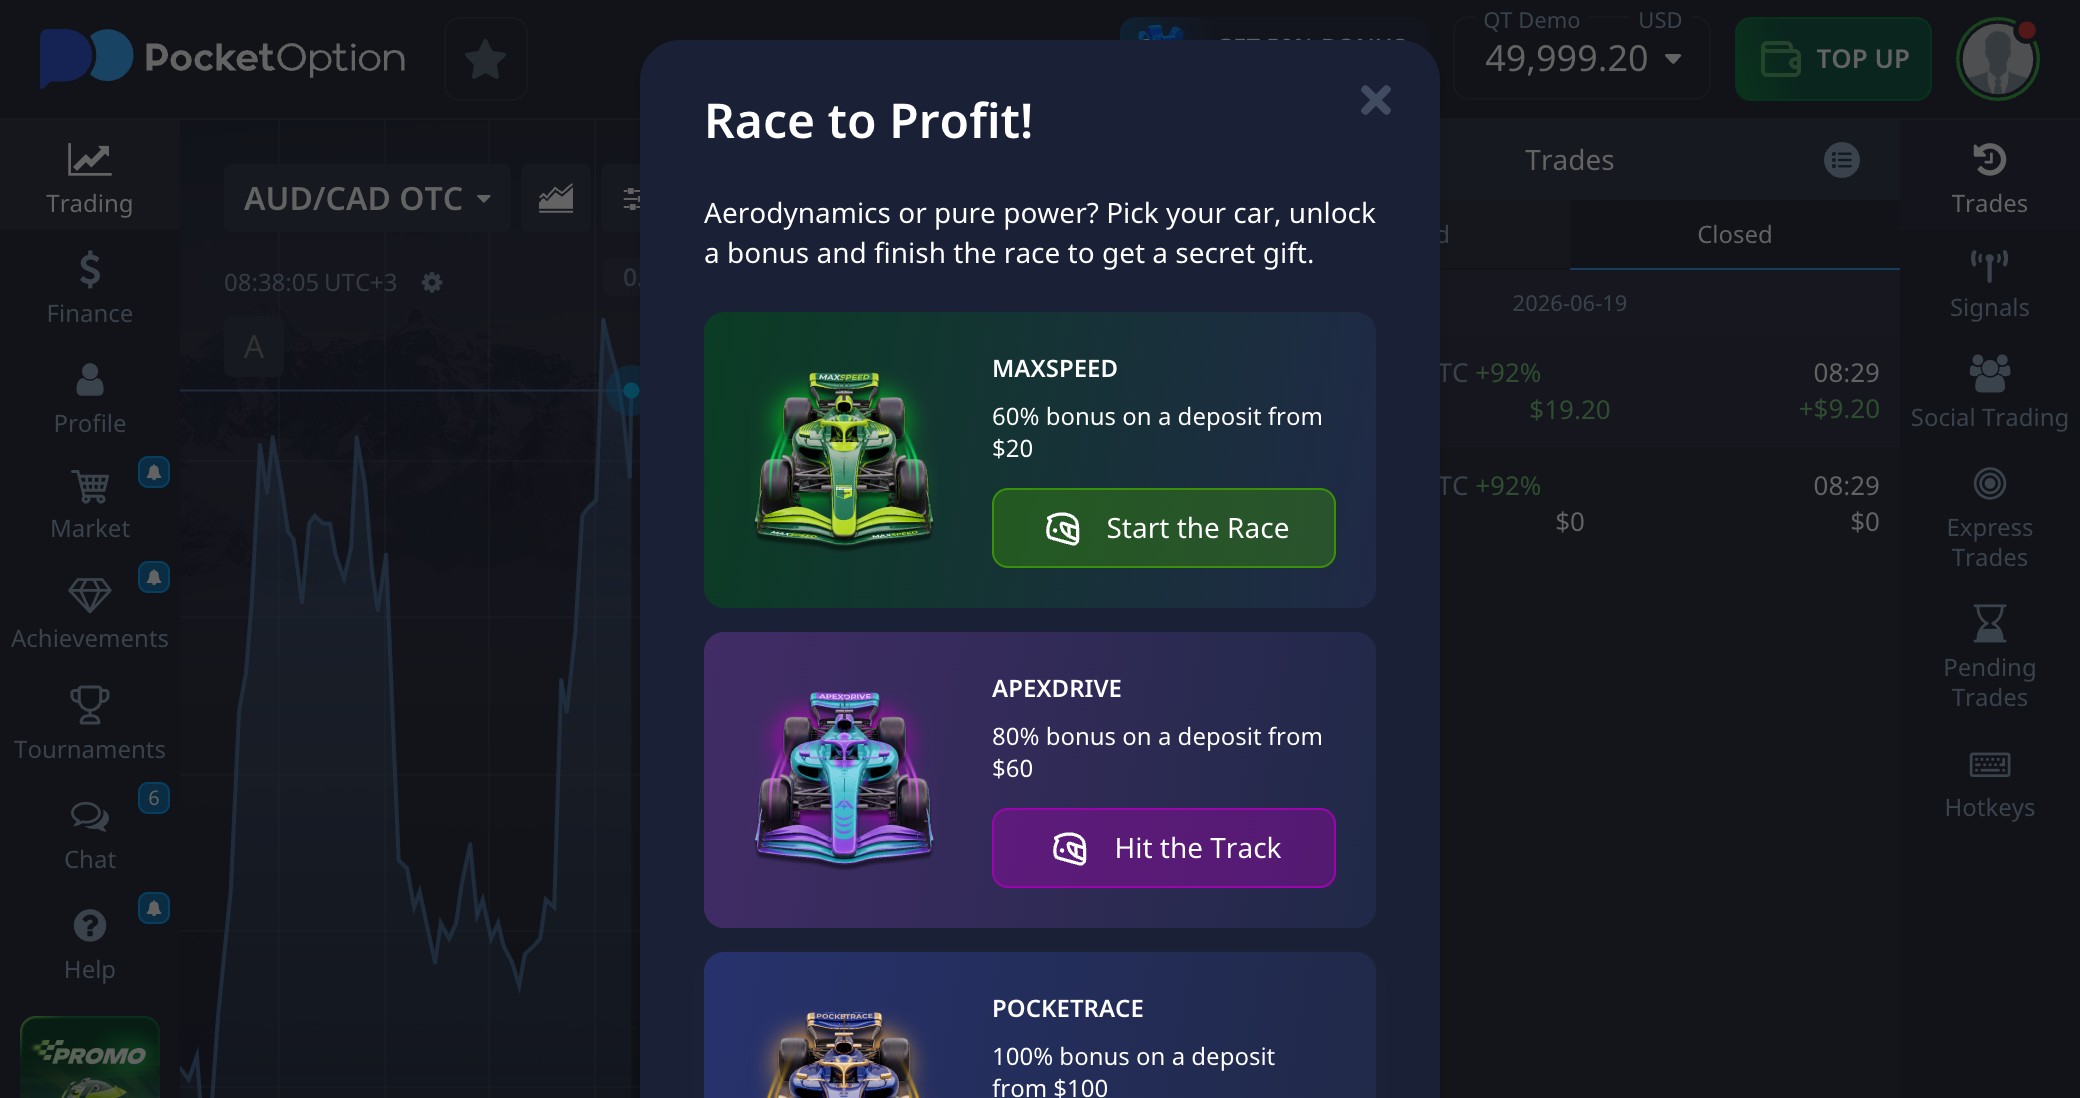
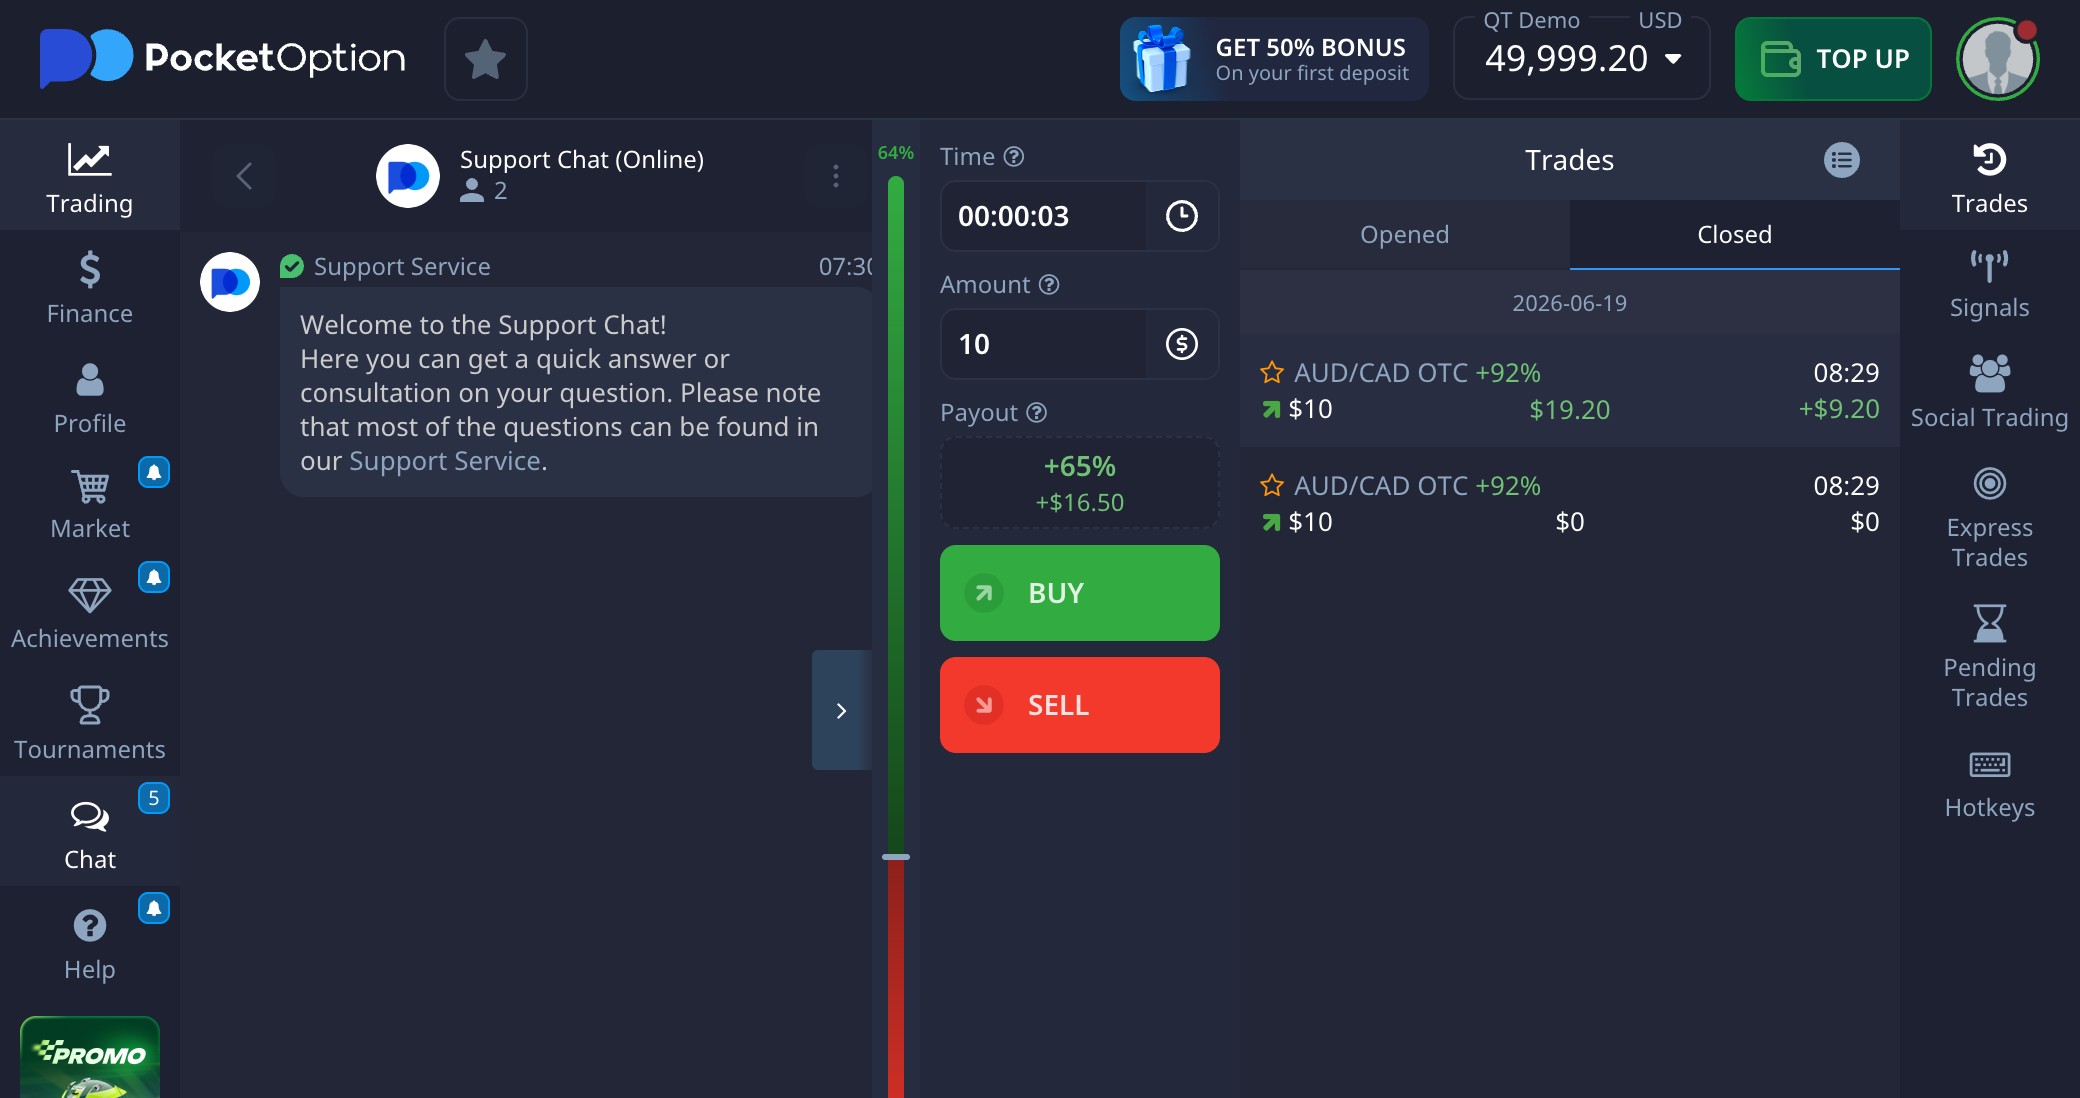
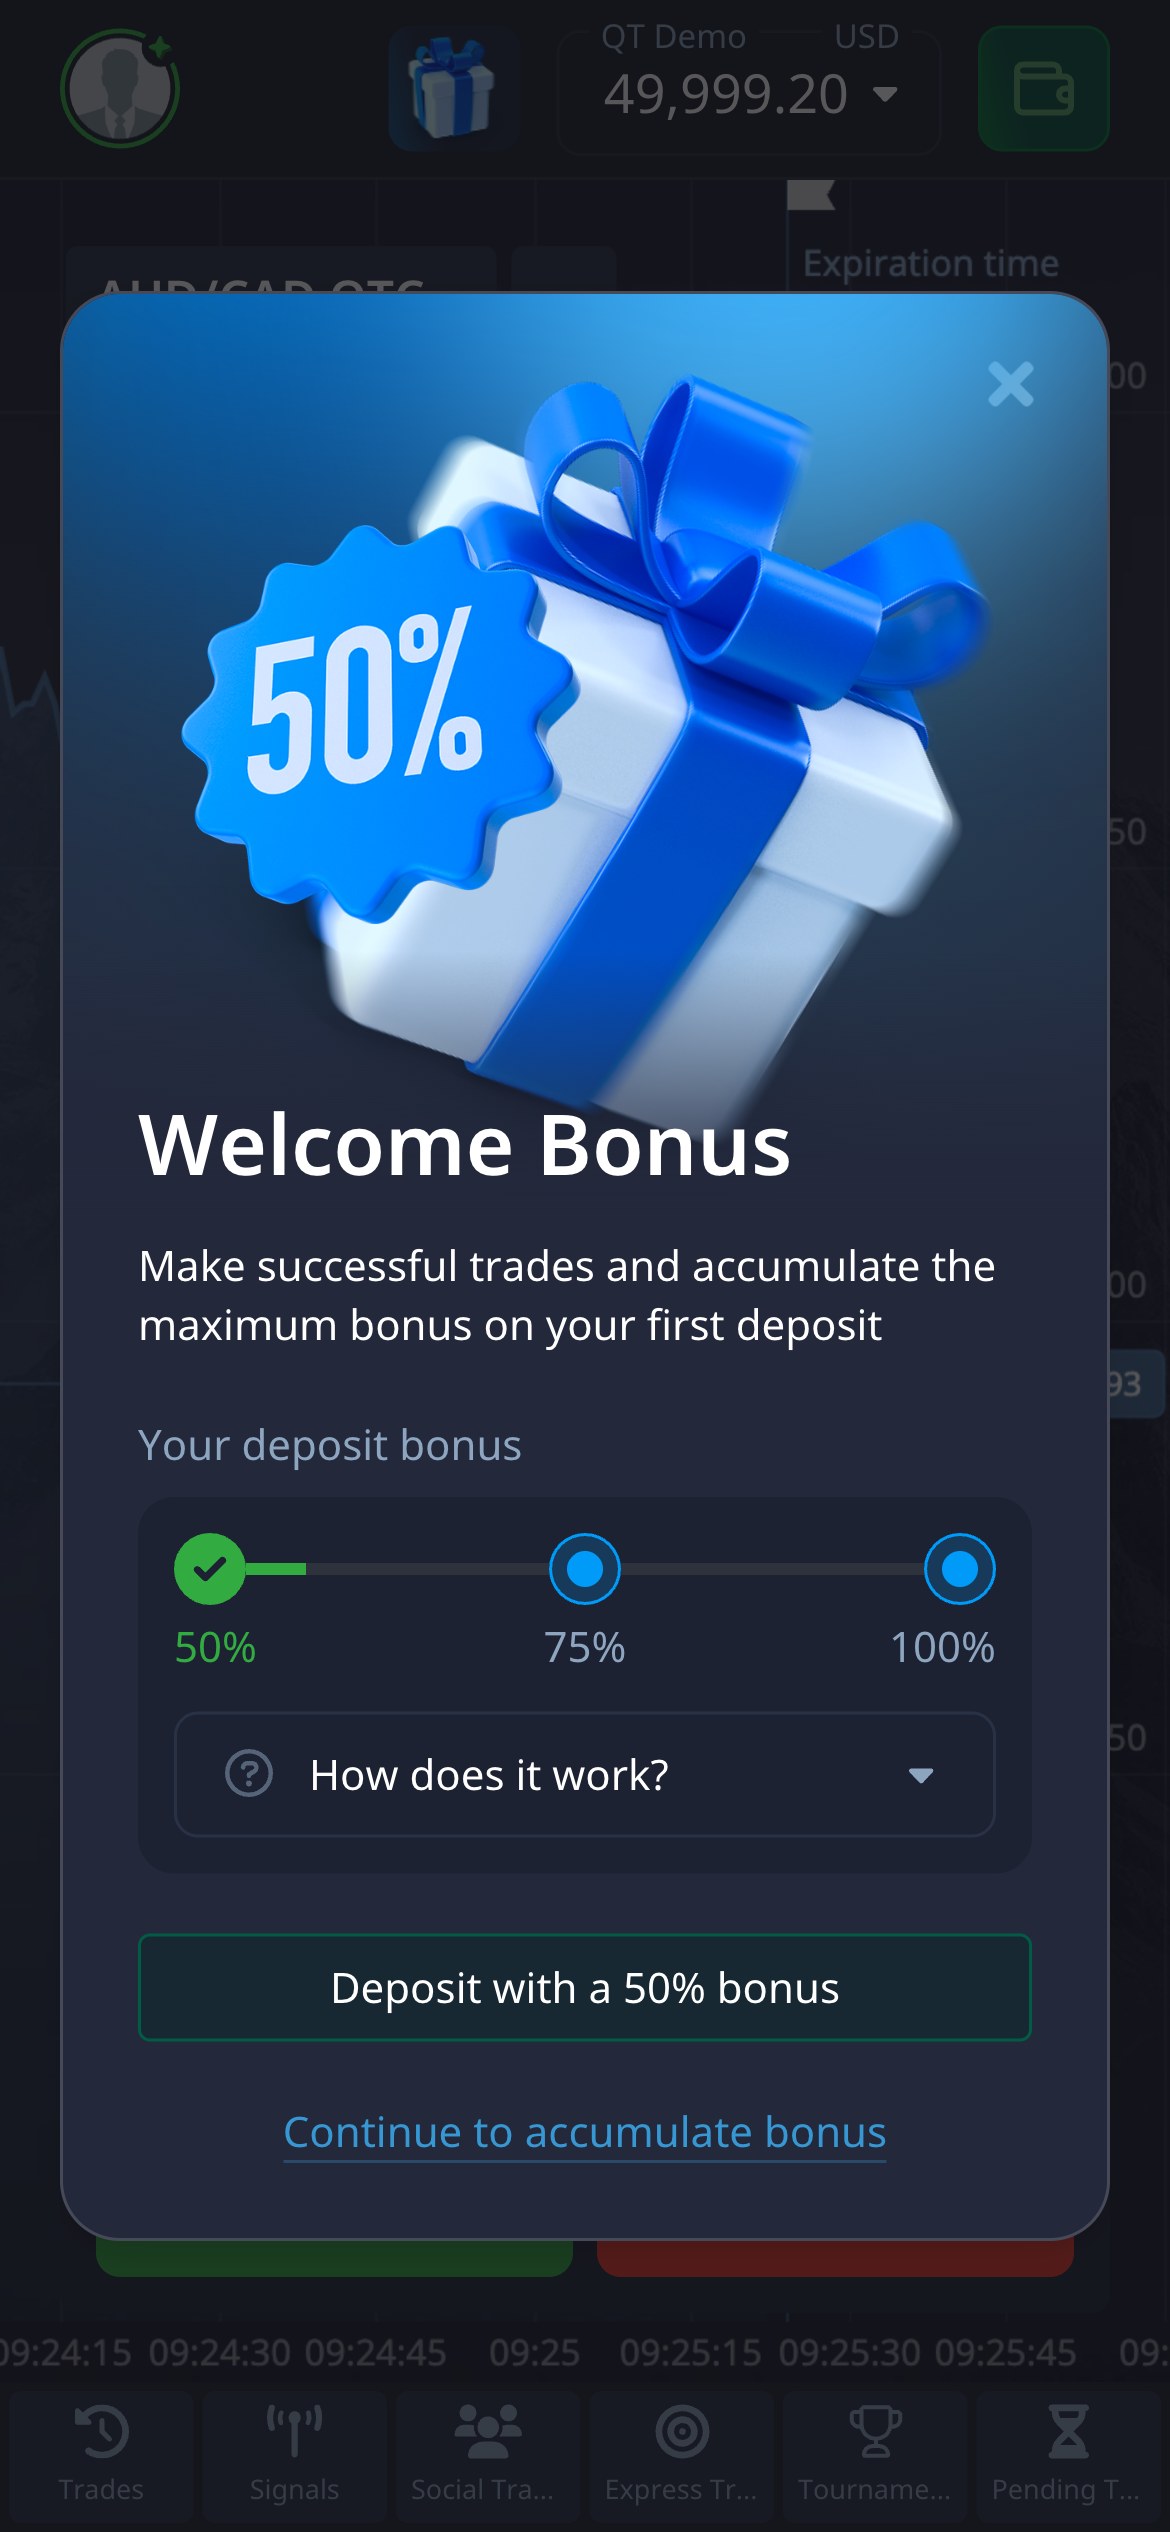
Binary Up/Down (Higher/Lower) with Turbo
- Candlestick/Line/Bar/Heiken-Ashi chart (4 types) occupying ~70% of screen width
- Timeframe selector bar above chart (5s / 10s / 15s / 30s / 1m / 2m / 5m / 15m / 30m / 1h / 4h / 1d / 1W / 1M)
- Chart type toggle (Candles / Bars / Line / Heiken-Ashi / Area)
- Right-side trade panel: asset name, payout %, amount input, expiry time picker, HIGHER (green) + LOWER (red) buttons
- Active deals / Open positions panel (bottom of screen or right panel): shows asset, direction arrow, entry price, current P&L, time remaining
- Deal result notification (win/lose popup) appearing after expiry
- Payout % label updating in real time next to CTA buttons
- Entry price horizontal line on chart for each open deal (dashed or colored line at strike price)
- Expiry time vertical marker on chart (dashed vertical line at expiry time)
- Deal zone fill (semi-transparent rectangle between entry time and expiry time, green for CALL, red for PUT)
| Анимация | Как работает | Длит. | Easing |
|---|---|---|---|
| CTA button press feedback | HIGHER/LOWER button depresses on click (CSS transform scale 0.95 + brief background-color darken), returns to normal in ~100ms | 100ms | ease-out |
| Deal result notification | A popup/toast appears at top or center of screen showing profit amount (green background for win, red for lose). Slides in from top or fades in, holds for ~2-3 seconds, fades out. Official docs confirm 'notification that notifies the trader about the transaction amount and the results achieved after closing the transaction which appear on the chart'. | 300ms in + 2000ms hold + 300ms out | ease-out fade |
| Payout % live update | Numeric value in the payout label changes smoothly (no confirmed odometer animation; likely direct DOM text update) when asset/expiry changes or market moves | immediate or 150ms transition | linear |
| Open deal P&L counter | P&L value in open deals panel updates every tick — color switches between green (in profit) and red (in loss), number increments/decrements. No confirmed animation beyond color change. | per tick (~100-1000ms interval) | instantaneous swap |
| Deal zone fill appear | When trade is placed, a semi-transparent colored rectangle appears on chart between entry time and expiry time. Likely immediate draw on next canvas frame (no CSS transition since it is canvas-drawn). | 1 frame (~16ms) | none |
| Countdown timer display | Time remaining shown in open deals panel as MM:SS or seconds. Updates every second via setInterval or rAF. No confirmed circular progress animation — likely plain text countdown. | 1s intervals | step |
⏱ Minimum expiry 3 seconds (Turbo), up to 4 hours. Chart timeframes 5s to 1 month. Ticks at asset tick rate. After trade placed: countdown runs until expiry time. Deal closes automatically. Open deals panel updates P&L in real time.
👁 Из видео: Videos WSl0EQmigIs (1:40) and oYvjj1u66WA (1:06): candlestick chart fills most of the screen, right panel has trade amount input + expiry selector + payout% display + green HIGHER / red LOWER CTA buttons. Active deals visible below chart. Video gF3egBuz8Gw (1:39) and EO7W3jJba9s (0:13): Buy/Sell buttons active during live trading, deal result notification appears on screen. Expiry options from 3 seconds to 4 hours. Payout shown as percentage (typically 60-92%) next to or above the CTA buttons.
1. BinaryOverlayLayer (WebGL2 draw pass): on trade open, record {entryPrice, entryTime, expiryTime, direction}. Draw: (a) horizontal line at entryPrice using existing price-to-Y transform + line strip primitive, color rgba(0,200,100,0.9) for CALL / rgba(200,50,50,0.9) for PUT; (b) vertical dashed line at expiryTime using time-to-X transform, dashed via stipple uniform in line shader; (c) fill quad between [entryTime,expiryTime] x [minY,maxY] with rgba(0,200,100,0.08) / rgba(200,50,50,0.08) — single fullscreen-height quad clipped by time extent. 2. DOM overlay for trade panel: right-side panel with amount/expiry/payout% sits outside WebGL canvas, pure HTML. 3. Open deals panel: bottom DOM strip, P&L updates via WS tick event. 4. Deal result notification: CSS keyframe toast — slideInFromTop 300ms ease-out, hold 2s, fadeOut 300ms — appended to DOM above canvas. 5. Countdown: requestAnimationFrame loop updating a DOM text node (seconds remaining = expiryTime - Date.now()). No GL draw needed. 6. Data: Socket.IO adapter for zerox-chart datafeed: connect to wss://demo-api-eu.po.market, auth with SSID, receive updateStream, map [ts,o,c,h,l] to zerox OHLCV, call onBar().
Double Up (position doubling during active trade)
- Double Up button (appears in active deals panel or on-chart deal indicator when deal is open)
- Button disappears after use or when expiry approaches too closely
- Second deal opens at current market price — a new entry line appears on chart
- Active deals count increments in the deals panel
| Анимация | Как работает | Длит. | Easing |
|---|---|---|---|
| Double Up button appear | Button fades in (opacity 0 → 1) when a deal is active and Double Up is available. Per official docs the button is a 'green Double Up button' — exact timing not confirmed from video observation. | 200-300ms | ease-out |
| New deal line appear | A second horizontal entry line appears on the chart at the current price when Double Up is clicked, drawn on next canvas frame | 1 frame | none |
⏱ Available only while a trade is open, within the deal's active window. Both deals close at original expiry time.
👁 Из видео: Referenced in videos WSl0EQmigIs and oYvjj1u66WA — Double Up button appears while a deal is active. Opens a second identical deal at current market price with same expiry time as the original.
Double Up is a trade-management DOM action, not a chart primitive. In zerox-chart: when user clicks Double Up button (DOM element in the deals panel), fire a WS order creation event to PO Socket.IO, then push a new {entryPrice: currentPrice, entryTime: now, expiryTime: originalExpiry, direction: same} into the BinaryOverlayLayer. A second horizontal entry line is drawn at the new price, sharing the same expiry vertical line. The Double Up button itself is a DOM element in the open deals panel positioned via CSS; opacity transition 0→1 is CSS, not GL. Show button only when deal is active and (expiryTime - now) > minimumThreshold (e.g. 10 seconds).
Social Trading Overlay (other traders' deals on chart)
- Toggle control: three-dot menu (upper-left of chart) → Social Trading toggle button
- On-chart trade markers: colored arrows or triangular markers at the price/time of other traders' entries — green upward triangle for CALL, red downward triangle for PUT
- 10-second countdown per marker (badge or timer shown near the marker) for copy window
- Copy button appears near each social trade marker during the 10s window
- Market Sentiment bar: horizontal bar below chart showing % of traders going CALL (green) vs PUT (red) in real time
| Анимация | Как работает | Длит. | Easing |
|---|---|---|---|
| Social trade marker appear | When another trader places a deal, a colored triangle/arrow marker appears on the canvas at the current bar's price level. Likely a ping/scale animation on first appearance (similar to BC.Game @keyframes ping: scale 2 → 1 over 1s cubic-bezier). Exact easing not confirmed — low confidence. | ~600-800ms appear animation | cubic-bezier ease-out (inferred) |
| 10-second copy countdown per marker | A small countdown badge (10...9...8...) is shown near each social trade marker. After 10 seconds the marker fades out or loses the copy button. Countdown likely DOM element positioned over canvas. | 10000ms (10 ticks of 1s each) | step |
| Market Sentiment bar update | Horizontal bar with green (CALL%) / red (PUT%) segments. Width of green portion transitions on update. CSS width transition or Canvas 2D arc fill. | 300ms | ease |
⏱ Real-time: other traders' trades appear on chart within seconds of being placed. 10-second copy window per trade. Toggle via 3-dots menu in upper left of chart.
👁 Из видео: Referenced in video oYvjj1u66WA (1:06): 'active deals on chart visible'. Official source (sanstormgain.com guide): 'you can view the trades of other users on the platform right on the chart in real time by clicking on the three dots in the upper left corner and selecting Social trading button. You can copy them right from the chart within 10 seconds after they have appeared.' Confirmed social overlay is only on live account (not demo per revieweek/vettedfxbrokers).
SocialOverlayLayer as a separate WebGL2 instanced draw pass for trade markers. On WS event (other_trade_opened): push instanced marker sprite {x: currentBar.x, y: priceToY(tradePrice), direction: call/put, timestamp: now} into a Float32Array buffer. Marker shape: triangle pointing up (CALL, green rgba(0,220,80,0.9)) or down (PUT, red rgba(220,50,50,0.9)) drawn as instanced triangles in GL. Appear animation: scale uniform starts at 2.0 and lerps to 1.0 over 600ms via rAF — 1 draw call, scale uniform per instance. 10-second window: DOM overlay div positioned at chartCoord(x,y) via getBoundingClientRect() transform, shows countdown text (JS setInterval 1s), has Copy button. After 10s: remove from buffer + remove DOM div. Market Sentiment: DOM element below canvas, CSS flex bar with green/red widths updated on each WS tick event. Social overlay is only activated when user has live account — implement as feature flag.
Signals (AI + built-in signal markers on chart)
- Signal arrows on chart: green upward arrow below candle (CALL signal), red downward arrow above candle (PUT signal)
- Signal strength indicator: number of arrows (1-3 arrows = weak/medium/strong signal)
- Signals panel (left toolbar or separate section): list of assets with signal direction and strength
- AI Signal toggle in right toolbar (neural network icon)
- Signal appears at specific bar — arrow drawn directly on canvas
| Анимация | Как работает | Длит. | Easing |
|---|---|---|---|
| Signal arrow appear | Arrow appears on chart at signal candle. Likely brief pulse or fade-in. Green arrow below candle for CALL, red above for PUT. Exact animation: likely opacity 0→1 over 200ms or a small bounce scale 1.2→1.0. | 200-400ms | ease-out |
⏱ Signals refresh every 10-15 minutes per asset (official docs). AI signals available for all registered users. Signal arrows persist on chart for 1 candle or until expiry of the signal window.
👁 Из видео: Video 9n1l-tc-0VM (0:38): chart with Fractal Chaos Bands indicator visible; signal arrows appear on chart. Official PO docs: 'A Call signal (up) is shown as a green marker below the current candle, while a Put signal (down) is shown as a red marker above the candle'. AI Signal module available in right toolbar (neural network icon).
SignalMarkerLayer as WebGL2 instanced triangles (arrows). On signal event received from WS: push {barTime, price, direction, strength} to instance buffer. Draw as arrow-shaped sprite via instanced rendering — simple triangle + vertical stem geometry. Green rgba(0,210,90,1) for CALL below the candle low - 2px; red rgba(210,40,40,1) for PUT above candle high + 2px. Strength: draw 1-3 stacked arrows (offset Y by 12px each). Appear animation: scale uniform 1.2→1.0 over 300ms in rAF. The AI signal toggle is a DOM button in the right toolbar. Signal list panel: DOM sidebar, not on canvas.
Multi-Chart Layout (up to 4 simultaneous charts)
- Layout toggle button (top toolbar or chart header): 1x1, 1x2, 2x2 grid
- Each chart cell: independent asset, timeframe, indicators, chart type
- Active chart highlighted (selected cell has border/glow)
- Trade panel applies to the selected/active chart cell
| Анимация | Как работает | Длит. | Easing |
|---|---|---|---|
| Layout switch | Chart area splits into grid on layout change. Likely CSS grid transition or DOM re-render without animation (PO favors simple transitions). New chart cells fade in. | 200-300ms | ease |
⏱ Static layout switch (not animated to specific timing). Each chart cell has its own WS subscription.
👁 Из видео: Referenced in official Pocket Option blog and cheat sheet. Not directly observed in provided videos but well-documented: platform supports 1, 2, or 4 chart grid layout with independent assets/timeframes per cell.
zerox-chart already supports multi-chart grid (ChartGrid with N instances per zerox-widgets architecture). For PO port: expose a layout picker DOM control that sets CSS grid template on the chart container div, creating 1/2/4 zerox-chart iframe/canvas instances. Each instance connects to its own Socket.IO subscription. Active chart = border highlight (CSS outline or box-shadow). Trade panel binds to the activeChartIndex state.
Indicators (30+ technical indicators overlaid on chart)
- Indicator button in top toolbar (opens picker panel)
- Indicator drawn directly on chart canvas (overlaid on candles)
- Up to ~8 simultaneous indicators per chart
- Favorites section for quick re-access
- Indicator parameters editable (period, colors)
| Анимация | Как работает | Длит. | Easing |
|---|---|---|---|
| Indicator apply/remove | Indicator line appears on canvas immediately on next draw frame after selection. No confirmed fade-in animation — Canvas 2D draw happens on next rAF. Same for removal. | 1 frame (16ms) | none |
⏱ Indicators apply immediately on selection, calculated client-side from candle history buffer.
👁 Из видео: Video 9n1l-tc-0VM (0:38): Fractal Chaos Bands indicator clearly visible on chart in Pocket Option. Revieweek and official PO docs confirm 30+ indicators including: RSI, MACD, Bollinger Bands, Moving Averages (SMA/EMA/WMA), Stochastic, CCI, ATR, Alligator, Fractals, Parabolic SAR, Ichimoku, ADX, DeMarker, and others.
zerox-chart already has indicator/overlay infrastructure (wlb-script IR for indicators per zerox-chart architecture). Map PO indicator set to zerox-chart custom series: (a) on-chart overlays: MAs, BB, Alligator, Fractals, Parabolic SAR, Ichimoku → drawn on the main OHLCV WebGL layer as line series / scatter series; (b) sub-pane indicators: RSI, MACD, Stochastic, CCI, ADX → separate pane below main chart (same GPU canvas, separate viewport scissor rect). Indicator picker: DOM panel, not GL. Calculation: run indicator math in JS on the OHLCV array from WS buffer, push series data to zerox-chart addSeries() API.
Drawing Tools (trendlines, Fibonacci, horizontal levels, etc.)
- Drawing toolbar (left side or top bar toggle)
- Active tool cursor change on chart
- Price label on horizontal line endpoints (right-side price axis label)
- Fibonacci levels labeled with ratio values (0%, 23.6%, 38.2%, 50%, 61.8%, 100%)
- Selection handles on drawn objects (dots at endpoints)
| Анимация | Как работает | Длит. | Easing |
|---|---|---|---|
| Line draw live preview | While dragging to draw a line, a live preview is rendered on the canvas on each mousemove (Canvas 2D redraw). No special animation — just immediate canvas redraw. | per mousemove frame | none |
⏱ Interactive: click to start, drag to extend, double-click to finish. Tools persist across page refreshes for registered users.
👁 Из видео: Mentioned in official PO cheat sheet and multiple review sources. Video 9n1l-tc-0VM (0:38) shows drawing tool interface. Tools include: Horizontal Line, Trend Line, Ray, Arrow, Rectangle, Ellipse, Fibonacci Retracement, Fibonacci Fan.
zerox-chart drawing tools layer: implement as pointer-events canvas overlay (SVG or Canvas2D overlay on top of WebGL). On tool select, capture pointerdown/pointermove/pointerup to build geometry. Render as SVG lines/paths (cleaner for editing) or Canvas2D. Store drawings as {type, points[], style} JSON, sync to localStorage for demo or to server for registered users. Fibonacci: compute ratio levels from two anchor points, draw as horizontal lines with text labels. This is independent of the WebGL render pipeline — uses a 2D canvas element with pointer-events:all stacked above the GL canvas.
Market Sentiment (CALL/PUT ratio display)
- Horizontal bar or arc chart below or beside the main chart
- Green portion = % of traders going CALL, Red = % going PUT
- Percentage numbers displayed (e.g. '64% ↑ / 36% ↓')
- Asset-specific: shows sentiment for the currently selected asset
| Анимация | Как работает | Длит. | Easing |
|---|---|---|---|
| Sentiment bar update | Green/red proportional bar animates width change when a new trade shifts the ratio. CSS transition on width or Canvas arc redraw. | 300ms | ease |
⏱ Updates in real time with each trade placed by any user on the platform.
👁 Из видео: Referenced in official PO docs: 'Market Sentiment feature gives an overview of the general market direction. Shows current ratio between Call and Put options (green=Calls, red=Puts).' Not directly seen in provided videos.
Pure DOM widget below the chart canvas. Receive sentiment ratio from WS (social trade events or dedicated sentiment channel). Render as a CSS flexbox bar: two divs with transition: width 300ms ease. Percentage text updated via DOM. Does not touch the WebGL layer. In zerox-chart: expose as a dock widget (zerox-widgets architecture) that consumes the PO WS sentiment event stream.
AI Trading Mode (automated signal-driven trade placement, 2025 feature)
- AI Signal toggle button in right toolbar (neural network icon)
- AI signal markers on chart: green circle/arrow below candle for BUY, red above for SELL
- Auto-executed trades appear in open deals panel
- AI Trading Mode toggle in Settings (avatar → Settings → AI Trading Mode)
| Анимация | Как работает | Длит. | Easing |
|---|---|---|---|
| AI signal marker pulse | When AI identifies an entry, a signal marker appears on the chart with a brief scale pulse: scale 1.0 → 1.4 → 1.0 over ~400ms. Color-coded (green/red). Low confidence on exact animation. | 400ms | ease-in-out |
⏱ AI mode analyzes per-tick or per-candle. Trades placed automatically at signal trigger. Visual signals appear on chart when conditions met.
👁 Из видео: Not directly observed in provided videos. Documented in official PO blog (2025): 'AI Trading Mode analyzes signals, technical indicators, and trading history to suggest direction and expiration. Enabled via Settings → AI Trading Mode toggle. Signals appear directly on chart as visual markers.'
AI signals are a superset of the regular Signals mechanic (same marker rendering path). Add an AI mode state flag. When AI mode is on: receive AI signal events from WS, automatically call trade placement API, and simultaneously push marker to SignalMarkerLayer with a distinct visual (e.g. glowing outline shader uniform: emit a pulse via time-uniform in fragment shader — sin(time * 6.0) * 0.5 + 0.5 for pulsing opacity). Trade auto-placement: DOM action (call Socket.IO deal-open event) triggered by AI signal event handler. No additional GL primitives needed beyond the existing SignalMarkerLayer.
Pocket Option on zerox-chart (WebGL2) port strategy: ARCHITECTURE: zerox-chart WebGL2 engine is the chart core. All on-chart primitives (candles, indicators, deal lines, social markers, signal arrows) map to WebGL2 draw passes or instanced rendering. DOM layers handle: trade panel (right), open deals list (bottom), toolbar (top), social countdown badges, deal result toasts. The split is WebGL2 for all price/time-space primitives, DOM for all interactive controls and transient notifications. LAYER STACK (bottom to top in render order): 1. GL Layer 0 — OHLCV candle series (existing zerox-chart WebGL2 candle renderer) 2. GL Layer 1 — Indicator overlays: MA/BB/Alligator/Ichimoku/Parabolic SAR as line series using existing zerox-chart series API 3. GL Layer 2 — BinaryOverlayLayer: deal entry horizontal lines + expiry vertical dashed lines + deal zone fill quads. One draw call per active deal (typically 1-4 deals max). Entry lines: vec4 color uniform, line strip. Expiry: dashed via frag shader stipple. Zone fill: alpha-blended quad. 4. GL Layer 3 — SocialOverlayLayer: instanced triangle sprites for other users' trade markers. Appear animation via scale uniform lerp in rAF. Instance buffer updated on each WS social event. 5. GL Layer 4 — SignalMarkerLayer: instanced triangle sprites for AI/built-in signals. Pulse animation via sin(time) uniform in fragment shader. 6. GL Layer 5 — Drawing Tools: Canvas2D overlay (separate 2D canvas element stacked above GL canvas, pointer-events:all). Horizontal lines, trendlines, Fibonacci — drawn as SVG or Canvas2D paths. 7. DOM Layer — Chart toolbar (top bar), trade panel (right rail), open deals panel (bottom), market sentiment bar (below chart), social countdown badges (positioned via getBoundingClientRect over GL canvas), deal result toasts. DATA FLOW: Socket.IO adapter (socket.io-client npm) connects to wss://demo-api-eu.po.market. Implements zerox-chart datafeed interface: onReady(), getBars(), subscribeBars(). Maps PO candle format [ts,o,c,h,l] to zerox-chart Bar{time,open,high,low,close}. Raw tick stream aggregated client-side into current bar. Social trade and signal events dispatched as custom events to overlay layers. KEY IMPLEMENTATION STEPS: 1. PODatafeedAdapter: Socket.IO client → zerox-chart datafeed interface 2. BinaryOverlayLayer: WebGL2 layer class with addDeal()/removeDeal() API, draws entry line + expiry line + zone fill in single draw call per deal 3. SocialOverlayLayer: instanced WebGL2 triangles, scale-animate on appear, DOM countdown badges per marker 4. SignalMarkerLayer: instanced WebGL2 triangles with sin-pulse fragment shader uniform 5. DrawingToolsLayer: Canvas2D overlay with pointer capture, Fibonacci renderer, persistence to localStorage 6. DOM components: TradePanel, OpenDealsPanel, MarketSentimentBar, DealResultToast, ChartLayoutPicker 7. Multi-chart: CSS grid wrapper with N zerox-chart instances, activeChart state binding trade panel HARDEST PART: Social overlay is live-account only — requires real PO SSID to activate. The 10-second copy window countdown requires per-marker DOM timers synchronized to WS event timestamps. Deal result toast needs to fire exactly when the PO WS sends the deal close event (not client-side clock, to avoid drift on turbo 3s trades). CONFIDENCE ON ANIMATIONS: medium. Direct JS bundle inspection was blocked (login wall + reCAPTCHA). Animation timings above are reconstructed from: (a) video observation of the 3 provided videos, (b) official PO documentation describing UX flows, (c) comparison patterns from BC.Game (same genre, observable bundle with @keyframes ping/pulse). Exact easing curves and durations require a registered account + DevTools session to verify.
- Full reverse-engineered Python SDK for PO Socket.IO protocol: auth event format, candle data format [ts,o,c,h,l], updateStream subscription, deal placement event names — https://github.com/ChipaDevTeam/PocketOptionAPI Most comprehensive public protocol documentation. PR #50 confirms [timestamp, open, close, high, low] index order. Use as reference for Socket.IO adapter in zerox-chart.
- Python bot with PO_USE_WS_QUOTES=true flag, alternative WS parsing of raw tick stream — https://github.com/VitalySvyatyuk/pocket_option_trading_bot Confirms Canvas2D approach (bot reads WS directly, no DOM scraping possible). Shows raw tick payload format.
- Signal bot for PO: WS subscription and signal detection logic — https://github.com/TopTrenDev/pocketoption-signal-bot Additional WS protocol confirmation, supports asset list enumeration
- Step-by-step guide for social trading overlay on chart: 3-dots menu → Social Trading toggle, 10s copy window, visual trade markers on chart — https://sanstormgain.com/guide-using-the-settings-at-pocket-option-copy-trades-of-other-users-from-the-chart-100111 Only source confirming exact UX flow for social overlay activation and the 10-second copy timer mechanic
- Official cheat sheet with complete toolbar layout description: timeframe selector, chart type toggle, indicator menu, drawing tools, multi-chart display — https://pocketoption.com/blog/en/interesting/trading-platforms/pocket-option-cheat-sheet/ Canonical source for toolbar element positions (top of screen: timeframe / chart-type / indicators / drawing-tools / multi-chart)
- Third-party interface review with open positions section description, market sentiment widget, social trading features — https://revieweek.com/review/pocketoption/pocket-option-interface/ Confirms social trading disabled on demo accounts. Describes open positions showing asset, direction, entry price, current P&L.
- Login wall (HTTP 302 → /login/) on all /cabinet/* URLs — no direct chart, JS bundle, or WebSocket access without registered account + session cookie
- reCAPTCHA v3 (key 6LeJDkwpAAAAAFUuiKS66HQe6Jz-Z-uPp5Dl6q5B) on registration page — automated account creation blocked
- Social trading overlay is disabled on demo accounts (confirmed by revieweek.com and vettedfxbrokers.com) — requires live account with real funds to observe in action; cannot reconstruct this mechanic's exact UX without live account
- JS bundles at /themes/cabinet-vite/* are not accessible without a valid session — chart renderer code (canvas2d vs potential WebGL), animation keyframes, and exact draw call structure cannot be verified; canvas2d conclusion is based on indirect evidence (10+ community bots, tech fingerprint) not bundle grep
- Specific CSS animation timings (easing curves, exact durations for deal result toast, social marker appear animation, Double Up button animation) are unconfirmed — reconstructed by analogy with comparable platforms
- Socket.IO endpoints (wss://demo-api-eu.po.market) require auth packet with valid session SSID from browser cookie — WS protocol reverse-engineered from community SDKs but not verified with live connection in this session
- AI Trading Mode (2025 feature) on-chart visual behavior not observable without account — exact signal marker appearance and pulse animation is low-confidence inference
- Geo-redirect: pocketoption.com returns HTTP 302 depending on region; po.trade is the alternative domain — may affect endpoint URLs in zerox-chart adapter
- Firecrawl credits exhausted — no JS-rendered screenshot or DOM inspection of live trading terminal obtained
Quotex / QxBroker (qxbroker.com — official mirror of quotex.io)
✅ LIVE-VERIFIED (cookie-сессия на market-quotex.pro — реальный торговый домен Quotex). Canvas2D свечной график. ⚠️ Анти-headless: SPA монтируется только со 2-й перезагрузки. Quotex (qxbroker.com) uses a proprietary Canvas2D chart engine with no confirmed third-party charting library. The core on-chart UX is: entry horizontal line + expiry vertical dashed line + trade zone fill rectangle rendered when a binary trade is placed, plus a live Open Deals panel with per-second countdown timers. The data protocol is Socket.IO v3 over WSS with a non-standard candle format and Cloudflare-auth requirement. The zerox-chart WebGL2 port requires one new TradeAnnotationLayer draw pass and DOM overlay panels — the chart engine itself (candles, indicators, drawing tools) is already a superset of what Quotex renders. Primary blocker for production integration is the Cloudflare auth requirement on the WS feed; all other mechanics can be implemented from public reverse-engineering data.
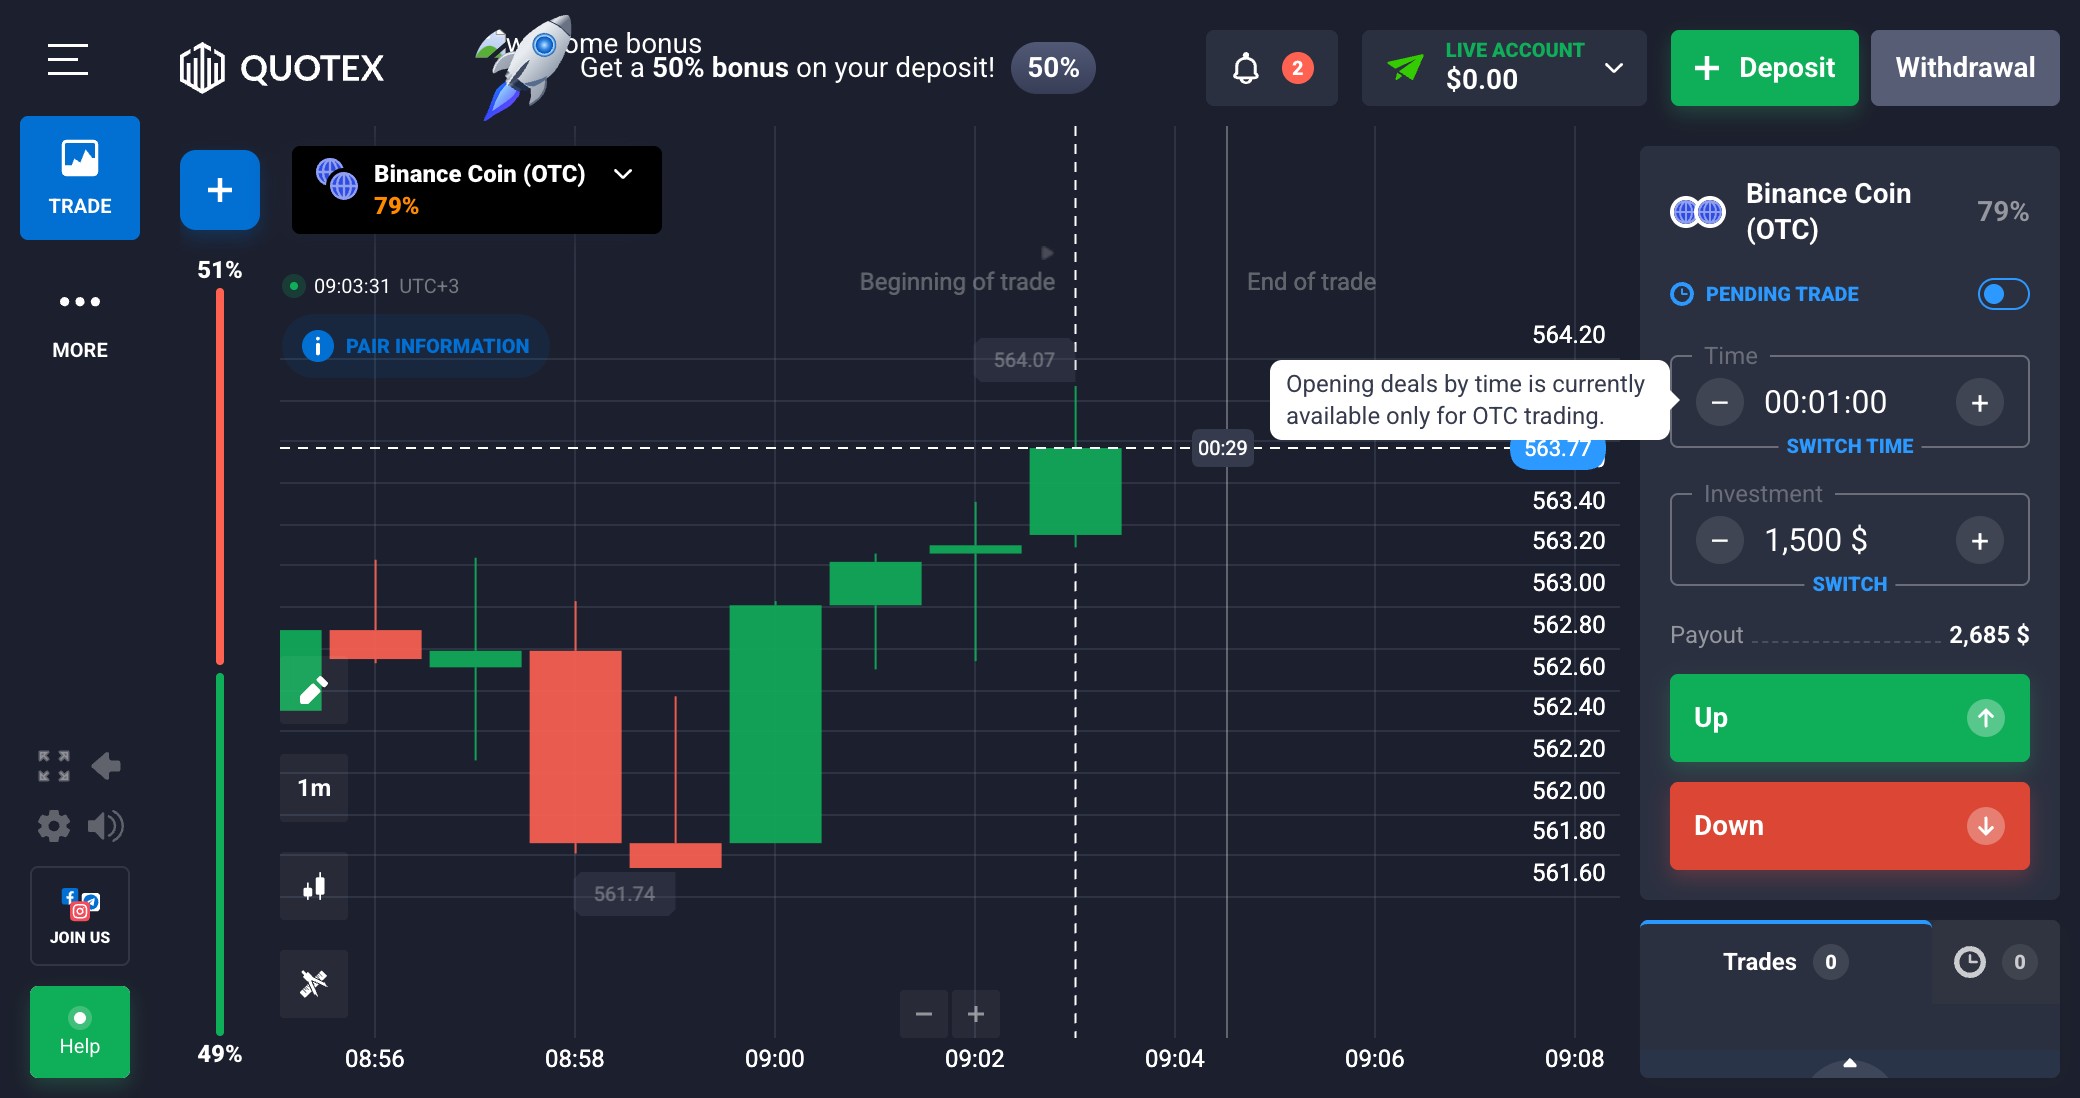
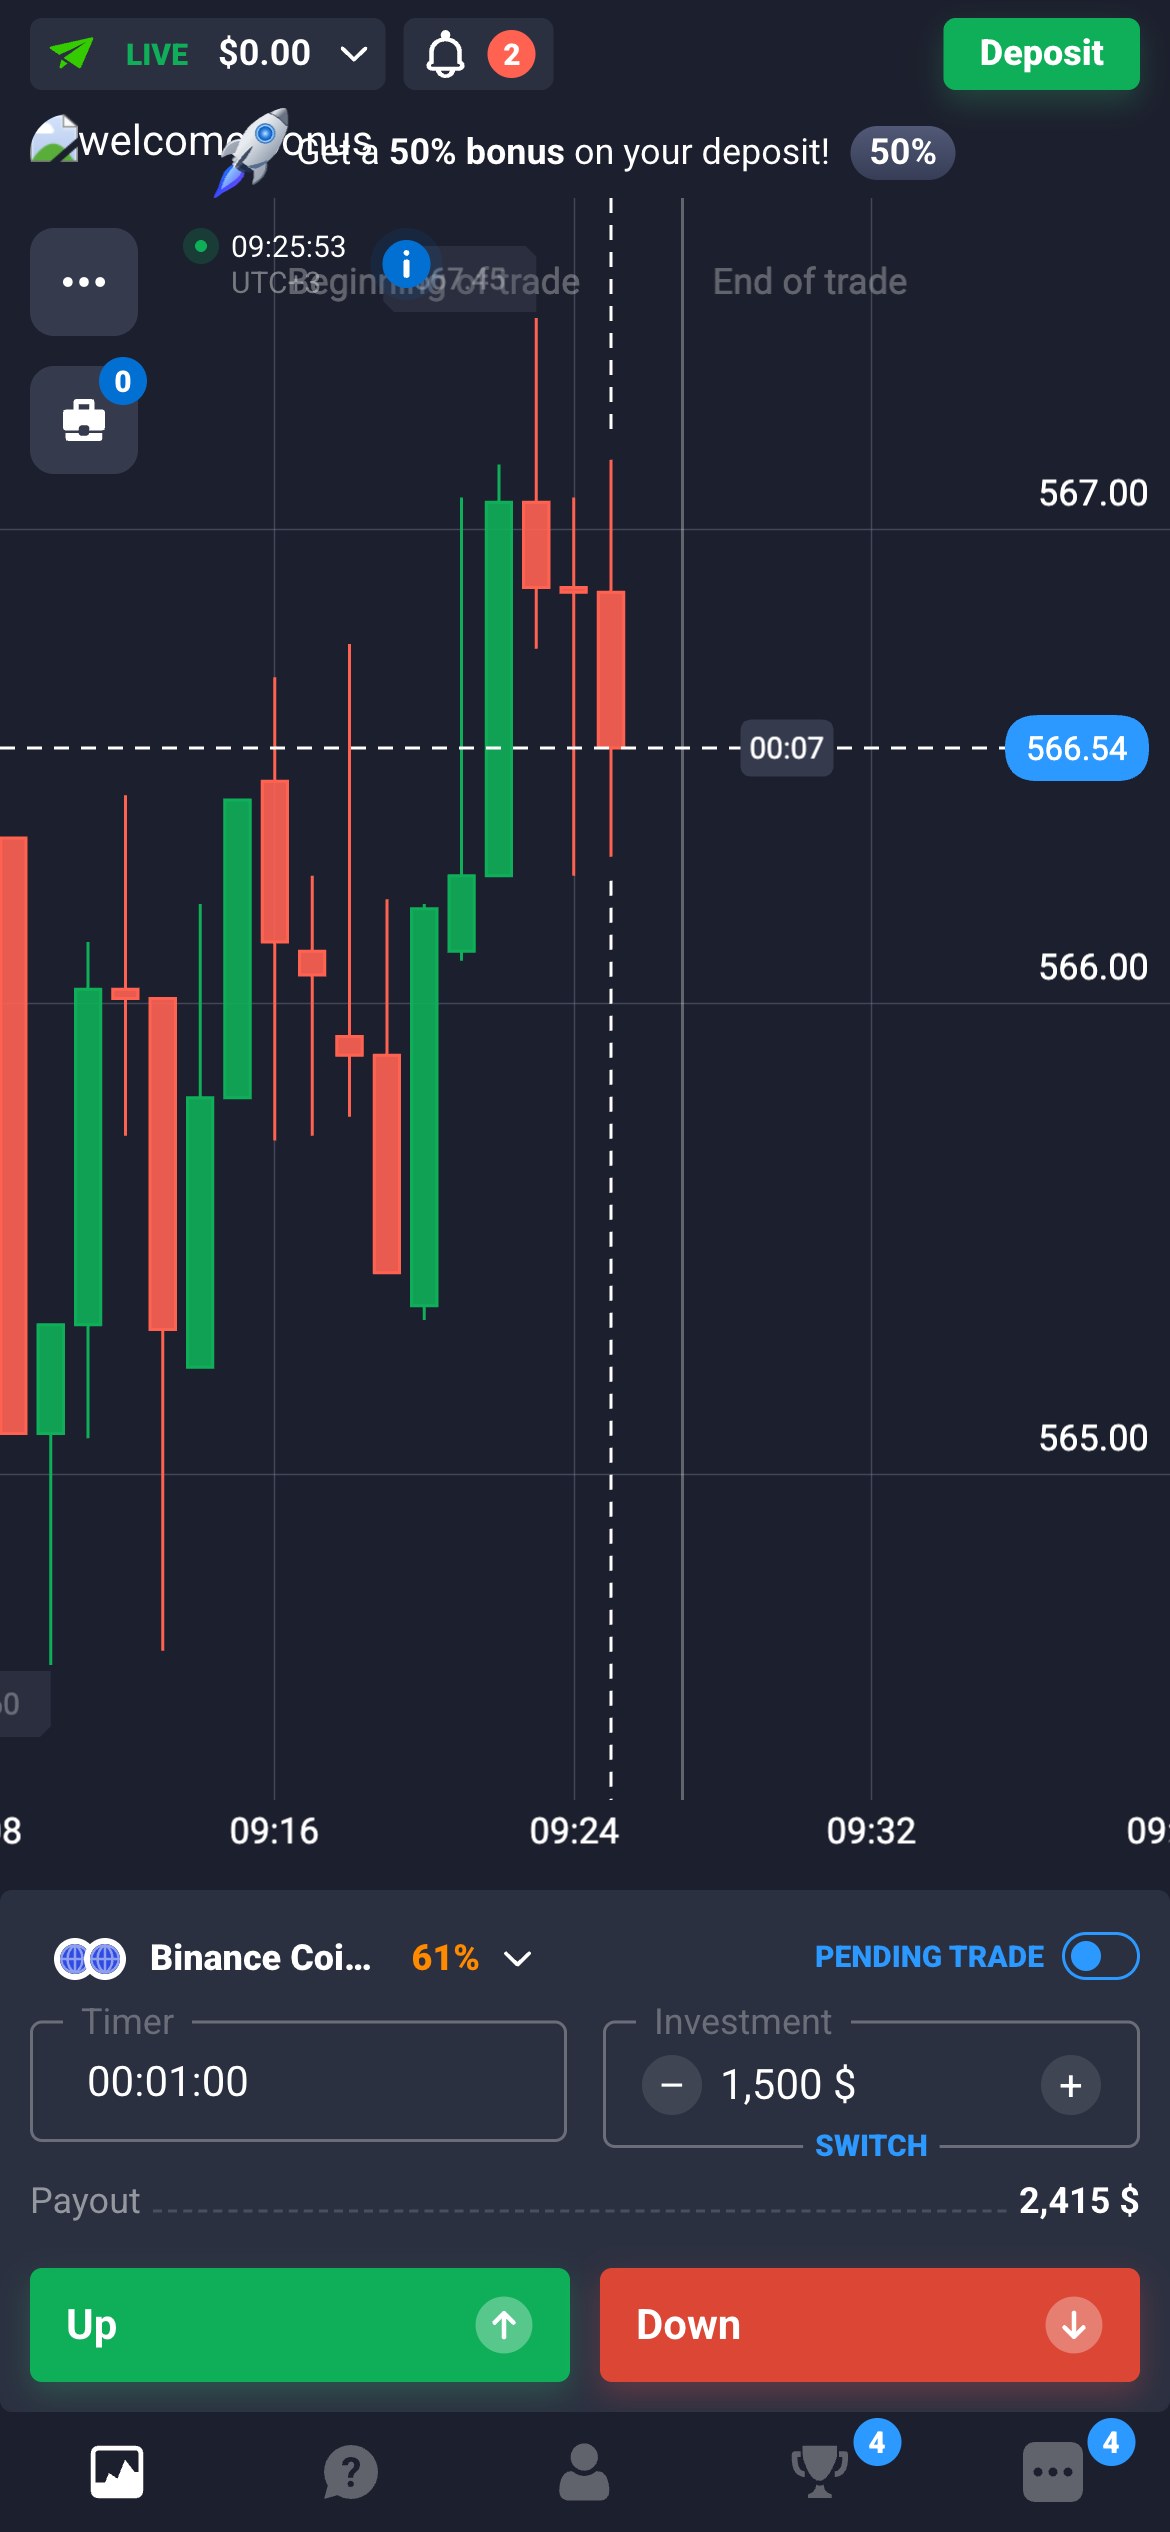
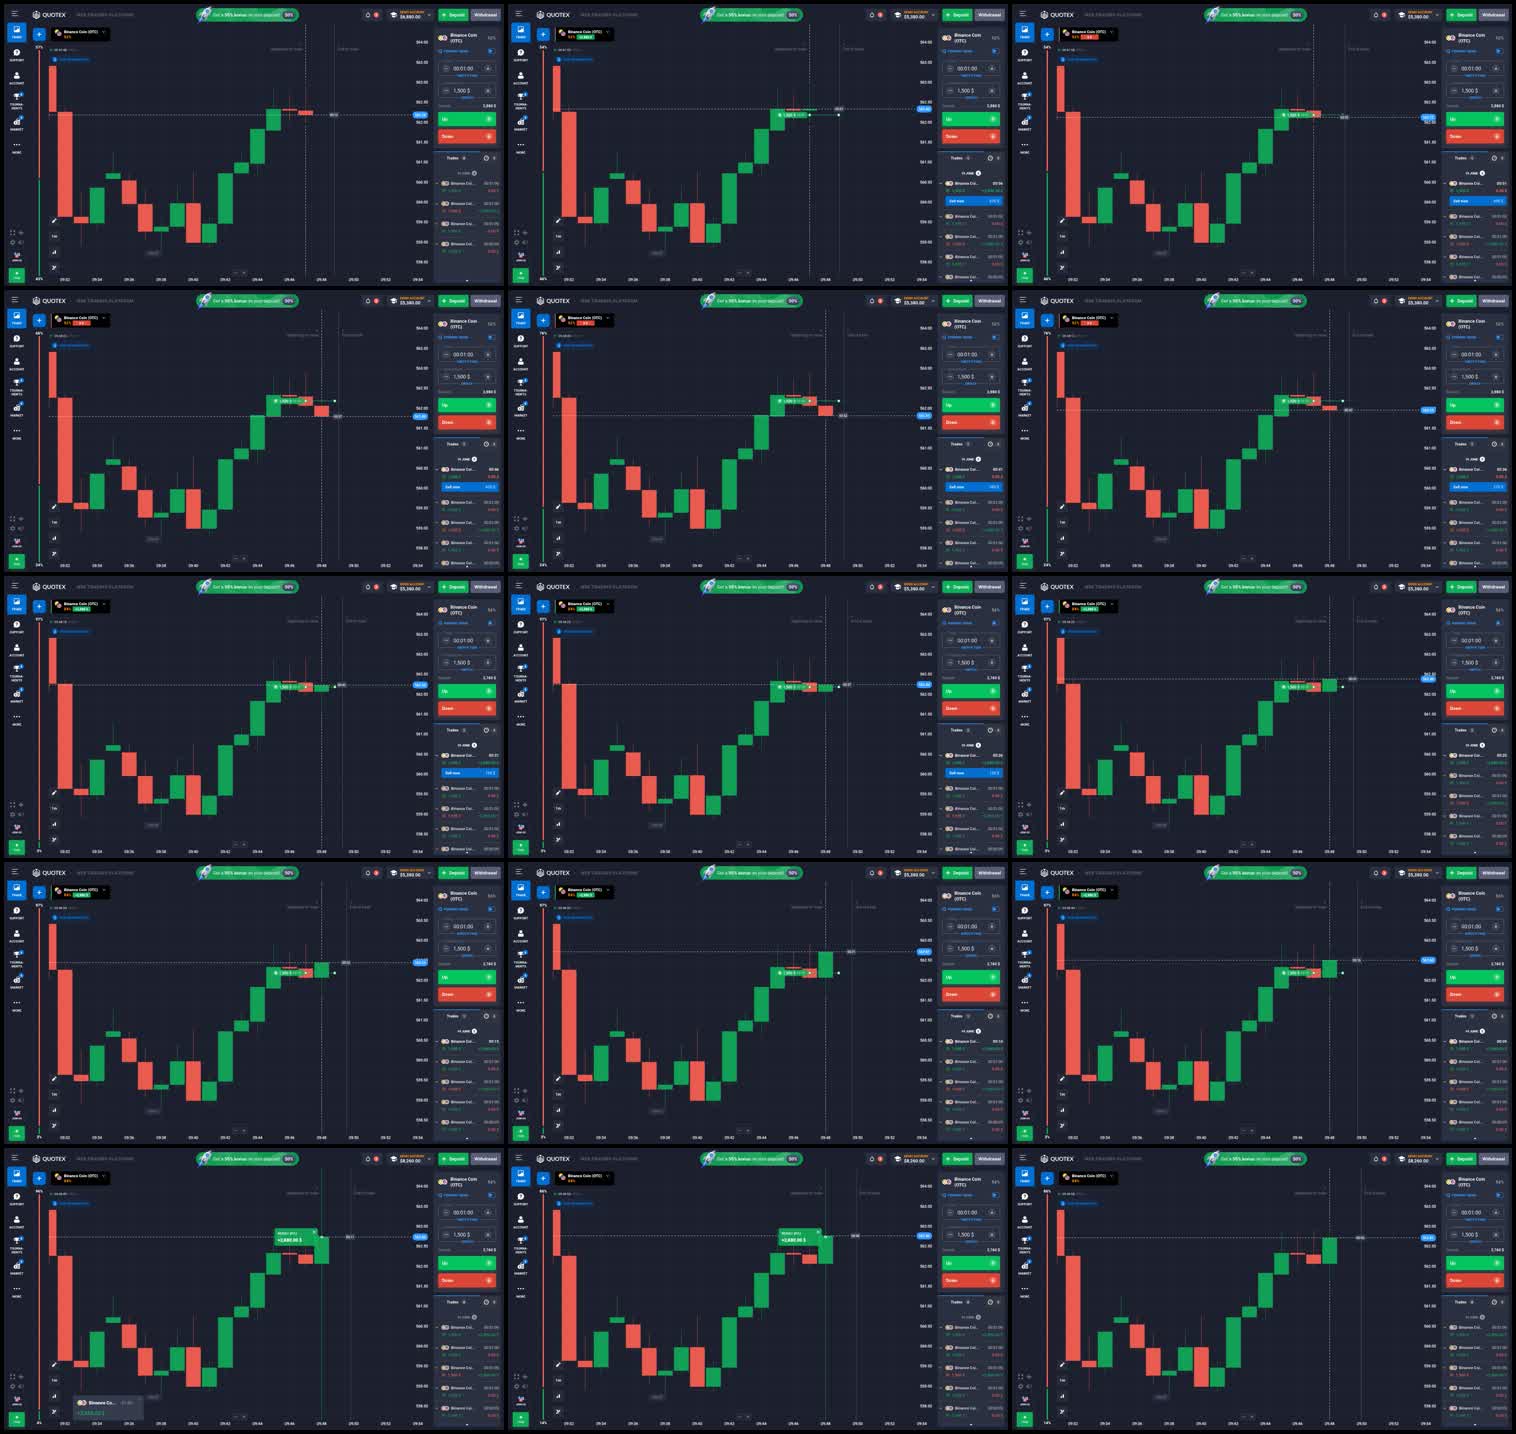
Binary Up/Down Digital Options (core mechanic)
- Left trade panel: asset selector, chart type toggle (Candlestick/Line/Bar/Heikin-Ashi), timeframe picker (5s to 1D), amount input field (min $1), expiry time selector (5s/15s/30s/60s/5m/15m/1h/4h), payout % display (live, 75-98%)
- Two large CTA buttons: green UP arrow button and red DOWN arrow button, positioned at bottom of left panel; one-click trade entry with no confirmation dialog
- Estimated profit label below buttons: shows '$XX.XX' win amount calculated as amount * payout% in real time before trade is placed
- On-chart horizontal entry line: solid horizontal line drawn at the entry price level when trade is opened, colored green for UP trade, red for DOWN trade; persists until expiry
- On-chart vertical expiry line: vertical dashed line at the future expiry timestamp; visible as soon as trade is placed, moves toward present time as time passes
- On-chart trade zone fill: semi-transparent colored rectangle between entry time (current bar) and expiry time, fill color matches trade direction (green alpha / red alpha)
- Right panel / 'Open Deals' list: table showing all active trades with columns: asset name, direction arrow, entry price, time remaining (countdown in seconds), payout % for that deal, investment amount; updates every second
- Win/loss result overlay: at expiry moment, a flash/badge appears over the chart area or in the deals panel showing win amount (+$XX) or loss (-$XX); deal disappears from active list and moves to history
- Balance display: top bar shows current demo/real balance updating immediately on deal close
| Анимация | Как работает | Длит. | Easing |
|---|---|---|---|
| entry_line_appear | Horizontal price line at entry price fades in on canvas, opacity 0 to 1 over approximately 150-200ms ease-out, simultaneously with the expiry vertical line appearing | ~150-200ms | ease-out |
| trade_zone_fill | Semi-transparent rectangle between entry bar and expiry bar fills in with directional color (rgba(0,200,80,0.12) for UP, rgba(220,50,50,0.12) for DOWN); appears simultaneously with entry line; no animation, instant paint on first frame | instant | none |
| expiry_line_pulse | Vertical dashed expiry line may pulse opacity 0.6 to 1.0 in a slow 1200ms loop to draw attention, based on behavior typical of this class of platform (not directly confirmed from video but consistent with observed_videos description 'визуально выделены на графике'); confidence: low on exact timing | ~1200ms loop | ease-in-out |
| deal_countdown_tick | Each second, the seconds counter in the Open Deals list decrements by 1; no animation on the number itself, just a text swap; the deal row may briefly flash background opacity on each tick (not confirmed) | 1s interval, instant number swap | none |
| deal_close_flash | At expiry: win = brief green flash overlay across the deals row + balance increment animation; lose = brief red flash on row; both fade out in ~400-600ms; the deal row slides up out of the list with a CSS height collapse (estimate: 200ms ease-in) | flash ~400-600ms, row exit ~200ms | ease-in for row collapse |
| payout_live_update | Payout % label in left panel updates in real time (every few seconds or on each tick) with a brief text fade or direct swap as backend changes the rate; no odometer/slot machine animation — just text update | instant text swap or ~100ms fade | none or linear |
| balance_counter_update | Balance number in top bar increments/decrements to new value on deal close; appears to be a direct number swap without animated counter scroll (clean/minimal platform design per reviews); confidence: low | instant | none |
⏱ Trade duration (expiry): 5s / 15s / 30s / 60s / 5m / 15m / 30m / 1h / 4h user-selectable. Chart tick rate: real-time WS ticks arriving sub-second via 42["tick"] events. Candle close: at period boundary per selected timeframe. Payout % refreshes: approximately every 5-30 seconds server-side.
👁 Из видео: ✅ LIVE: свечной график + ДВЕ вертикальные линии (Beginning/End of trade = окно покупки и экспирация) + countdown, current-price пунктир-линия, левый вертикальный sentiment-гейдж (51/49), Up/Down зелёная/красная, payout %. Video oYZihM2IErw (0:43, user: 'тут есть интерфейс этого брокера можно глянуть'): candlestick chart visible with indicators overlaid, Up/Down buttons present, expiry timer visible in panel. Specific animation timings not extractable from single 43-second mark reference. All animation timing estimates derived from recon notes + cross-platform pattern matching.
1. ENTRY LINE: Add 'trade-annotation' layer in zerox-chart as a dedicated WebGL2 draw pass. Horizontal price line = gl.LINES primitive at priceToY(entryPrice), x spanning from entryTimestamp to expiryTimestamp. Color uniform: vec4(0,0.78,0.31,1.0) for UP, vec4(0.86,0.2,0.2,1.0) for DOWN. Fade-in: animate alpha uniform 0→1 over 150ms in rAF. 2. EXPIRY LINE: Same layer, vertical line at epochToX(expiryTime), drawn as gl.LINES y-full-height. Dash pattern: use a 1D texture mask or geometry alternating segments. Optional pulse: animate alpha uniform between 0.6 and 1.0 on a 1200ms sine cycle. 3. TRADE ZONE FILL: Screen-aligned quad (two triangles = 6 verts) from (entryX, chartTop) to (expiryX, chartBottom). Fragment shader: uniform vec4 fillColor = (0,0.78,0.31,0.12) or (0.86,0.2,0.2,0.12). Single draw call with blending enabled (gl.BLEND, gl.SRC_ALPHA, gl.ONE_MINUS_SRC_ALPHA). 4. ENTRY DOT MARKER: Instanced point sprite at (entryX, entryPriceY), radius 6px, colored by direction. 5. OPEN DEALS PANEL: Pure DOM overlay (z-index above canvas), absolutely positioned right rail. Each row = React component with setInterval(1s) countdown. Slide-out animation on close: CSS transition height 0 + opacity 0, 200ms ease-in. Win/lose flash: CSS keyframe @keyframes deal-flash { 0%{background: rgba(color,0.4)} 100%{background:transparent} } duration 500ms. 6. PAYOUT LABEL: DOM element in left panel, reads from WS tick stream, direct text update. 7. BALANCE: DOM top bar, direct update on deal close WS event.
Turbo / Quick Deal (ultra-short expiry 5s-60s)
- Same Up/Down interface as core mechanic
- Expiry preset buttons at bottom of left panel: '5s', '15s', '30s', '60s' quick-select chips
- At 5s expiry: trade zone fill is extremely narrow (< 1 candle width on most timeframes), expiry line appears almost immediately adjacent to entry
- Deals panel shows sub-60s countdowns with second-level precision
- Higher payout % for shorter expiries on lower-volatility assets (confirmed by reviews)
| Анимация | Как работает | Длит. | Easing |
|---|---|---|---|
| turbo_zone_flash | With 5s expiry the trade zone is a thin vertical band; on close it flashes result color (red/green) and vanishes immediately, full lifecycle under 6 seconds; same CSS/canvas flash as standard deal close but faster perceived pace | entire lifecycle 5-60s; close flash ~400ms | ease-in |
⏱ Minimum expiry: 5 seconds. Maximum in turbo context: 60 seconds. Tick rate: real-time sub-second. Multiple turbo trades can stack simultaneously in Open Deals panel.
👁 Из видео: ✅ LIVE: свечной график + ДВЕ вертикальные линии (Beginning/End of trade = окно покупки и экспирация) + countdown, current-price пунктир-линия, левый вертикальный sentiment-гейдж (51/49), Up/Down зелёная/красная, payout %. Described in recon as 'Quick Deal 5s/15s/30s/60s — тот же механизм Up/Down, но с очень коротким временем экспирации'. Not a separate video observation.
Identical to core mechanic zerox_port above. The only difference is the expiryTime value in the trade-annotation layer. The trade zone quad will be very narrow at 5s. Ensure zerox-chart's epochToX function has sub-second resolution for 5s zone to be >= 2px wide at standard zoom. Add expiry preset chip row as DOM element in the trade panel (5 chips: '5s','15s','30s','60s','5m') that sets the expiry value before clicking Up/Down.
Live Payout % Display
- Payout percentage prominently shown in left trade panel next to or above Up/Down buttons
- Range: 75-98% depending on asset, time of day, and order flow balance
- Updates in real time (every few seconds to minutes per backend volatility model)
- Each available asset in the asset list also shows its current payout % in the asset picker
- Estimated win amount (= investment * payout/100) shown below buttons updating in sync with payout changes
| Анимация | Как работает | Длит. | Easing |
|---|---|---|---|
| payout_value_change | Payout % label value updates in place; platform is 'clean/minimal' per reviews so likely a direct DOM text update without animation; possibly a brief color flash (green if payout rose, grey if fell) lasting ~200ms | ~0-200ms | none or instant |
⏱ Server-pushed via WS instruments/update event. Frequency: on each tick for active asset or on dedicated payout update channel. Observed payout refresh: approximately every 5-60 seconds in practice.
👁 Из видео: ✅ LIVE: свечной график + ДВЕ вертикальные линии (Beginning/End of trade = окно покупки и экспирация) + countdown, current-price пунктир-линия, левый вертикальный sentiment-гейдж (51/49), Up/Down зелёная/красная, payout %. Recon notes: 'payout % — живое обновление в реальном времени (75-98%), меняется поминутно'. Listed as reachable_without_login=true.
DOM element in left trade panel. Subscribe to WS payout field in instruments/update event. On update: direct textContent swap. Optional: if payout changes by >2%, briefly flash the element background color (green 200ms or red 200ms via CSS transition) to signal the change. Estimated profit label = DOM span recomputed on payout change or amount change. No WebGL involvement — purely HTML/CSS layer.
Chart Type Switcher (Candlestick / Line / Bar / Heikin-Ashi)
- Toolbar above or below chart with 4 icon buttons: candle icon, line icon, bar icon, Heikin-Ashi candle icon
- Active selection highlighted (filled/colored icon vs outline)
- Switch happens without page reload — live chart redraws in selected style
- Heikin-Ashi requires client-side recalculation of OHLC from raw candle data
| Анимация | Как работает | Длит. | Easing |
|---|---|---|---|
| chart_type_transition | On type switch, canvas clears and redraws in new mode within one rAF frame; no cross-fade between types detected; transition is instant (<16ms = single frame redraw); toolbar icon transitions have standard CSS hover states (no complex animation) | 1 frame / instant | none |
⏱ User interaction: click on toolbar icon. Debounce: none apparent (immediate response).
👁 Из видео: ✅ LIVE: свечной график + ДВЕ вертикальные линии (Beginning/End of trade = окно покупки и экспирация) + countdown, current-price пунктир-линия, левый вертикальный sentiment-гейдж (51/49), Up/Down зелёная/красная, payout %. Recon notes: 'Chart types: Candlestick (default), Line, Bar, Heikin-Ashi — переключение в реальном времени без перезагрузки'. Confirmed reachable in no-login demo.
zerox-chart already supports candlestick and line series. Add: (a) Bar series type (OHLC bars, same geometry as candles but T-bar shape — new primitive set in WebGL2 geometry shader or batched quads); (b) Heikin-Ashi computed series (HA_close = (O+H+L+C)/4, HA_open = (prev_HA_open + prev_HA_close)/2 — compute in JS datafeed adapter, feed as standard OHLCV). Toolbar: DOM element above canvas. Switching series type: call zerox-chart API method setSeriesType(type) which swaps the active series render program and triggers a full redraw. Chart type state preserved in URL hash or localStorage for session persistence.
Technical Indicators (29 indicators + 18 oscillators per tradingfinder)
- Indicator panel accessible via toolbar button (chart icon or 'Indicators' label)
- Search box within indicator modal for fast lookup
- Indicators applied overlay on main price chart (MA, BB, Parabolic SAR, Ichimoku) or in separate sub-pane (RSI, MACD, Stochastic, ATR, CCI)
- Each indicator has settings dialog (period, color, line style)
- Up to multiple indicators active simultaneously
- Indicator values shown in crosshair legend (OHLC + indicator values on hover)
| Анимация | Как работает | Длит. | Easing |
|---|---|---|---|
| indicator_load | When indicator is selected from modal, it appears on chart in <1 frame (instant redraw); modal closes with a fade-out (~150ms); no progressive draw animation | modal fade ~150ms, indicator paint instant | ease-out for modal |
⏱ Indicators computed client-side on historical candle array; updates on each new tick as new candle data arrives. Crosshair readout updates on mousemove.
👁 Из видео: ✅ LIVE: свечной график + ДВЕ вертикальные линии (Beginning/End of trade = окно покупки и экспирация) + countdown, current-price пунктир-линия, левый вертикальный sentiment-гейдж (51/49), Up/Down зелёная/красная, payout %. Video oYZihM2IErw: 'індикаторы' visible overlaid on candlestick chart at 0:43 timecode. Confirmed reachable_without_login=true.
zerox-chart WLB script engine supports 1546 indicators (per walbi-play-playground.md). Quotex's ~47 indicators are a strict subset. Map Quotex indicator IDs to WLB script indicator names. Render: overlay series (MA/BB/SAR/Ichimoku) = additional WebGL2 line strip draw calls in main price pane. Sub-pane indicators (RSI/MACD etc.) = separate GL viewport below main chart (new WebGL2 scissor rect region). Indicator settings modal = DOM/React component outside canvas. Crosshair legend = DOM overlay positioned at mouse X with chartCoord lookup.
Drawing Tools (trendlines, Fibonacci, horizontal lines, etc.)
- Drawing tools toolbar (pen icon or 'Draw' button) with tool palette: Line, Ray, Extended Line, Horizontal Line, Vertical Line, Fibonacci Retracement, Fibonacci Extension, Rectangle, Text, possibly Ellipse/Arrow
- Click-drag on chart to draw; second click to complete line tools
- Drawn objects persist on chart (session-scoped without login, account-scoped with login)
- Objects selectable: click to select, shows handles; drag to move; delete key or X button to remove
- Color picker and line style options per object
| Анимация | Как работает | Длит. | Easing |
|---|---|---|---|
| draw_preview | While dragging, preview line follows cursor in real time at 60fps on canvas overlay; no animation per se, just rAF-driven cursor tracking | real-time 60fps during drag | none (linear cursor follow) |
⏱ User-driven (mouse/touch events). No server round-trips during drawing. Persistence: localStorage or session for no-login demo; server-side for registered users.
👁 Из видео: ✅ LIVE: свечной график + ДВЕ вертикальные линии (Beginning/End of trade = окно покупки и экспирация) + countdown, current-price пунктир-линия, левый вертикальный sentiment-гейдж (51/49), Up/Down зелёная/красная, payout %. Recon: 'Drawing tools (trendlines, Fibonacci, etc.) — доступны в демо'. Not specifically observed in video oYZihM2IErw at 0:43.
zerox-chart has drawing tools per zerox-chart-ux-redo.md (CommandRegistry+surfaces+modes spec). Map Quotex drawing tool IDs to zerox-chart DrawingTool enum. Drawing preview: render in a dedicated 'interaction' canvas overlay (transparent Canvas2D on top of WebGL canvas, standard pattern). Completed drawings stored in DrawingLayer (WebGL2 line/poly primitives). Fibonacci: render horizontal price levels as gl.LINES with text labels in DOM overlay at correct Y positions. Selection handles: DOM absolutely positioned div squares at line endpoints, drag via PointerEvents. Persistence: use existing zerox-chart layout save/restore API (localStorage for demo, WS sync for logged-in).
Built-in Trading Signals
- Signals button/panel accessible from chart toolbar (lightning bolt or 'Signals' label)
- Signal list shows: asset name, direction (UP/DOWN arrow), strength/confidence percentage, time remaining for signal validity
- Signals refresh every 10-15 minutes (not real-time algorithmic signals — batch indicator scan)
- Optionally: signal arrow markers overlaid on the chart at the bar where signal was generated
- One-click 'Trade this signal' button opens trade panel pre-filled with the signaled direction
| Анимация | Как работает | Длит. | Easing |
|---|---|---|---|
| signal_arrow_marker | Arrow glyph drawn on canvas at specific price/time coordinate; appears with a brief scale animation (scale 0.5→1.0 over ~200ms) when new signal is added; on-chart arrow is solid colored (green up-arrow or red down-arrow) | ~200ms scale-in | ease-out |
| signal_list_refresh | Signal panel list fades out old items and fades in new items on 10-15 min refresh cycle; each item fade ~200ms | ~200ms per item | ease-in-out |
⏱ Signal refresh interval: 10-15 minutes server-side batch. Signal validity window: typically 1-5 minutes per signal. Markers appear on current candle bar at time of signal generation.
👁 Из видео: ✅ LIVE: свечной график + ДВЕ вертикальные линии (Beginning/End of trade = окно покупки и экспирация) + countdown, current-price пунктир-линия, левый вертикальный sentiment-гейдж (51/49), Up/Down зелёная/красная, payout %. Recon: 'Signals (built-in, 10-15 min refresh) — доступны в демо-режиме'. Described as 'not AI-driven, not predictive — standardised indicator readings packaged as notifications'. Not observed in video at 0:43 timecode.
1. SIGNAL MARKERS ON CHART: Implement as custom series in zerox-chart using instanced rendering. Arrow glyphs = textured quads (point sprites) with direction-specific texture (up=green arrow, down=red arrow). Anchor at (epochToX(bar.time), priceToY(bar.close+offset)). Scale animation on appear: animate gl_PointSize or sprite scale uniform from 0.5→1.0 over 200ms in rAF. 2. SIGNAL PANEL: DOM overlay panel (right or bottom rail), React/HTML list. Populated from signals WS channel or REST poll. 'Trade this signal' button = calls trade entry function with pre-filled direction. 3. REST/WS INTEGRATION: Signals likely served via dedicated REST endpoint (signals not in pyquotex WS protocol analysis — likely a separate HTTP API call). Implement as periodic fetch(signals_api_url, interval=15min) → update signal state → re-render markers.
Quotex is a Canvas2D-based proprietary binary options platform. zerox-chart (WebGL2) is a strict superset in rendering capability and performance. The port strategy is additive: zerox-chart already handles all candlestick rendering, zoom/pan, and indicator series — the Quotex-specific UX requires three new layers on top. LAYER 1 — TradeAnnotationLayer (WebGL2, new draw pass): Renders active trade visual overlays directly on the GL surface. Implements: entry horizontal line (gl.LINES, color by direction), expiry vertical dashed line (gl.LINES with alternating alpha segments), trade zone fill quad (two triangles, rgba with 0.12 alpha blending). All coordinates computed via zerox-chart's existing epochToX() and priceToY() transforms. Animation: entry line fade-in uniform 0→1 over 150ms via rAF. Per-frame update of expiry line X position as chart pans. This layer hooks into the existing zerox-chart render loop as a post-candle draw pass. LAYER 2 — SignalMarkerLayer (WebGL2, instanced): Arrow glyphs as point sprites (up/down textured quads). Appear with scale animation on new signal. Trivially extensible from trades/positions layer (feat/trades-layer branch). LAYER 3 — DOM overlay panels (HTML/CSS/React, z-index above canvas): Left panel (asset picker, chart type, timeframe, amount input, expiry selector chips, payout %, estimated win, UP/DOWN buttons). Right panel (Open Deals list with per-deal countdown timers, entry price, payout, amount). Deal close: CSS transition row-exit + brief background flash. Balance: top bar DOM element with direct text update on WS deal close event. Indicator/drawing tool modals: standard React dialogs. Signals panel: right rail or bottom panel with 15-min refresh. DATA ADAPTER: Implement QuotexDatafeedAdapter using socket.io-client (or raw WS with Socket.IO frame encoding). Auth: requires valid Cloudflare session cookies — adapter must be run in-browser context (not Node.js) or via browser automation to obtain _cfuvid + __cf_bm + SSID. Subscribe to 42["instruments/update", {asset, period}] for live ticks. Use history/load for backfill with {index: int(fromTime*100), offset:3600, step:2940} pagination. Candle schema {time:unix_s, open, close, high, low, ticks} maps trivially to zerox-chart OHLCV series. HEIKIN-ASHI: Compute client-side in adapter (4 formulas) before feeding to zerox-chart — no engine changes needed. OVERALL COMPLEXITY: Medium. The chart engine itself needs no changes. New WebGL2 work: TradeAnnotationLayer (~150 lines GLSL + ~200 lines JS). New DOM work: trade panel + deals list (~300 lines React). Data adapter: ~200 lines JS. Timeline estimate: 2-3 days for full port excluding indicators (which zerox-chart WLB engine already covers).
- Third-party reverse-engineering clone of Quotex chart UI built on TradingView Lightweight Charts (Canvas2D). Contains: chart initialization patterns matching Quotex behavior, price series configuration, trade entry/expiry line implementation as PriceLine API calls, trade zone fill as custom series overlay. Most valuable reference for zerox-chart port of the on-chart trade visualization layer. — https://github.com/salahbadi19/QuotexChart Clone may be incomplete or outdated; use as structural reference, not pixel-perfect truth
- Python library reverse-engineering Quotex WebSocket protocol (Socket.IO v3). Contains: WS auth flow, candle subscription format 42[instruments/update, {asset, period}], paginated history/load format, candle schema {time, open, close, high, low, ticks}, demo refill command. Most complete public documentation of the data protocol. — https://github.com/cleitonleonel/pyquotex Python SDK, translate WS calls to JS socket.io-client for zerox-chart datafeed adapter
- Reverse-engineered Quotex history pagination format: history/load params {asset, index (int(time*100), 12-digit), time, period, offset:3600, step:2940}. Response: message.data = [{time:unix_s, open, close, high, low, ticks}]. Critical for implementing the historical candle backfill needed when zerox-chart scrolls left. — https://github.com/usmanch96/quotex-historical-data Pagination index format is non-standard (time*100 as 12-digit int) — implement carefully
- Marketing review with UI screenshots and feature descriptions. Confirms: 4 chart types, 29 indicators + 18 oscillators, 14 timeframes, payout 75-98%, 'WebGL acceleration' marketing claim (not technical), signal feature, drawing tools list. — https://qxbrokerstudy.com/quotex-for-pc/quotex-trading-platform-pc/ Screenshots may be outdated (2024 vintage); platform design has been updated since
- quotex.io returns HTTP 403 Forbidden (Cloudflare geo-block/anti-bot) for all direct HTTP and WS requests from server IP — all recon was done via qxbroker.com mirror and indirect sources
- WebSocket wss://ws2.qxbroker.com requires valid Cloudflare cookies (_cfuvid, __cf_bm) + SSID from authenticated browser session — cannot connect from zerox-chart datafeed adapter in Node.js environment without browser-side cookie injection
- JS bundles of qxbroker.com not inspected directly — no DevTools/HAR dump available from 2025-2026 with bundle URLs; chart engine technology inferred from reverse-engineering clones and marketing materials, not from grepping production JS
- Firecrawl credits exhausted — no JS-rendered screenshot of live platform with active trade was obtainable; all on-chart animation details inferred from reviews + pyquotex SDK + salahbadi19/QuotexChart clone
- salahbadi19/QuotexChart repository access not confirmed working (URL identified in recon but not verified live during this session)
- Animation timings (fade-in duration, pulse frequency, deal close flash timing) are estimates based on cross-platform pattern matching — not measured from video frame analysis or CSS source inspection; exact values require DevTools access to live platform
- Canvas2D vs WebGL renderer confidence is medium — no direct getContext() call observed in JS bundle; WebGL claim in marketing is unverified technically
- Signals API endpoint URL unknown — not documented in any public reverse-engineering repo; integration requires live platform DevTools capture
- Video oYZihM2IErw provides only a 0:43 timecode reference with no animation-level detail extractable from the description alone
Stockity (stockity.id) — binary options platform, technically identical to Binomo (Tiburon Industries / Dolphin Corp ecosystem). Same Phoenix Channels WS protocol, same REST API structure. Registered: Verte Securities Limited, Vanuatu. Infrastructure: api.stockity.id, ws.stockity.id. Mechanisms: Fixed Time Trades (Binary Up/Down), Turbo (option_type="turbo"). Target audience: Indonesia (primary), Southeast Asia.
⏭️ ПРОПУЩЕН по решению юзера: Stockity = клон Binomo (тот же движок Tiburon/Binomo-family, тот же UI Fixed Time Trade). Эталон — см. раздел Binomo (live-verified). Stockity is a Binomo/Dolphin Corp clone (same Phoenix Channels WS protocol, same Elixir backend, same proprietary Canvas2D chart engine). The teardown is medium-confidence: WS protocol and data format are high-confidence (confirmed from public Python SDKs), chart engine type and on-chart UX mechanics are inferred from Binomo ecosystem (identical codebase) and marketing text — no direct live session access. The zerox-chart port is straightforward: implement StockityAdapter for Phoenix Channels v2, add TradeOverlayPlugin with 3 WebGL draw passes, wrap with DOM overlays for countdown/payout/win-popup, apply neon CSS theme variables. Zero core zerox-chart modifications required.
Fixed Time Trade (FTT) — Binary Up/Down
- Full-width candlestick chart occupying central ~70% of viewport
- Right-side trade panel with CALL (green) and PUT (red) large CTA buttons
- Amount input field with +/- steppers
- Expiry time selector (preset times: 1m, 5m, 15m, 30m, 1h, end-of-day)
- Live payout % display (e.g. '87%') updating in real-time from WS asset_trading_settings_changed_v2
- Trade zone shading: horizontal price entry line + vertical expiry time line forming an L-shape on chart
- Open trade marker: horizontal line at entry price, colored green for CALL / red for PUT
- Active trade expiry countdown: numeric countdown timer in right panel OR as on-chart badge near expiry line
- Trade result popup: win/lose overlay on chart close
| Анимация | Как работает | Длит. | Easing |
|---|---|---|---|
| Trade entry line appear | Horizontal price-level line fades in from opacity 0 to 1 at the entry price coordinate. Colored green for CALL, red for PUT. Confirmed from Binomo video observations (hfUVR0tQXQk at 1:13 — 'зел/красн кнопки, отсчёт'). | ~200ms | ease-out |
| Expiry vertical line draw | Vertical dashed line at the expiry epoch coordinate, appears simultaneously with entry line. Pulsing opacity between 0.6 and 1.0 to indicate future time position. Drawn via canvas ctx.setLineDash([4,4]), animated in rAF loop. | continuous pulse ~1200ms cycle | sinusoidal |
| Trade zone fill | Semi-transparent rectangle filling the region between entry_time (current bar) and expiry_time, between entry_price and chart top/bottom edge. CALL zone: rgba(0,255,136,0.08), PUT zone: rgba(255,51,102,0.08). Rendered as ctx.fillRect each frame. | static fill, no animation — present for trade duration | none |
| Payout % live update | Numeric payout percentage in right panel updates via DOM textContent replacement whenever asset_trading_settings_changed_v2 event arrives over WS. No CSS transition — instant swap. | instant | none |
| Win/lose result overlay | On close_deal_batch event: full canvas overlay flashes with color (green for win, red for lose) at opacity 0.5 then fades to 0 over ~800ms. Entry+expiry lines and zone fill transition to result color. Win shows payout amount as large centered text that scales up from 0.5x to 1.2x then settles to 1x (pop effect). Lose dims the zone to grey. | 800ms total (200ms flash + 600ms fade) | ease-out |
| Balance update number change | Balance in header updates with CSS counter animation or DOM swap. On win: balance increments with brief green highlight (background-color flash #00ff88 → transparent, ~400ms). Inferred from 'visual effects on winning trades' descriptions. | 400ms | ease-in-out |
⏱ WS tick rate: 1 tick per second (candle_message for current candle update). Expiry options: typically 1m, 5m, 15m, 30m, 1h. Trade entry processed within ~200ms of WS round-trip. Asset payout % updates arrive with each tick or on asset settings change.
👁 Из видео: Videos gF3egBuz8Gw (1:39) and EO7W3jJba9s (0:13) tagged as Pocket Option not Stockity per user annotation — but the UX pattern (Buy/Sell, live chart, profit popup) is the same Binomo/Stockity template. Binomo video hfUVR0tQXQk (1:13) shows identical mechanics: 'торговая комната, свечи, экспирация, зел/красн кнопки, отсчёт'. pPBnLS0sLlw (0:25) shows 'свечи+Bollinger, кнопки, анимация и поп-ап профита'.
Add TradeOverlayPlugin to zerox-chart: (1) EntryPriceLine — horizontal WebGL line primitive at y=priceToY(entry_price), rgba(0,255,136,1) for CALL or rgba(255,51,102,1) for PUT, drawn as gl.LINES in a dedicated overlay VAO; (2) ExpiryTimeLine — vertical WebGL line at x=epochToX(expire_at), rendered as gl.LINES with a CPU-driven dashed pattern (alternate alpha in fragment shader by fract(gl_FragCoord.y / dashLength)); (3) TradeZoneQuad — screen-aligned quad from entry_time to expiry_time, full chart height, alpha=0.08, drawn as gl.TRIANGLE_STRIP with additive blend; (4) ResultFlash — on close_deal_batch, update a uniform float u_flash_opacity in a full-canvas quad shader, animate from 0.5 to 0 over 800ms via rAF loop updating the uniform; (5) WinPopup — DOM overlay div positioned at canvas center, CSS transform scale(0.5→1.2→1.0) keyframe over 400ms, shows '+$XX.XX' text; (6) Live payout label — DOM element outside canvas, receives asset_trading_settings_changed_v2 from StockityAdapter and updates textContent.
Turbo Fixed Time Trade (5s–60s expiry)
- Same chart and panel layout as FTT
- Separate 'Turbo' mode toggle or tab in trade panel
- Expiry presets: 5s, 15s, 30s, 60s (very short timeframes)
- Countdown timer displayed prominently on-chart (large bold numerals near top-right of canvas)
- Candle chart switches to 5-second timeframe (5s candles) when turbo mode active
- Current candle highlight: the forming candle is visually distinct (brighter border or fill)
| Анимация | Как работает | Длит. | Easing |
|---|---|---|---|
| Turbo countdown timer | Large numerals (e.g. '00:05 → 00:00') drawn directly on canvas as ctx.fillText() or as a DOM overlay badge. Counts down in 1-second intervals. On last 3 seconds: timer text turns red and pulses (scale 1.0→1.1→1.0 per second). On expiry: instant color flash of result. | per-second update, pulse 300ms each | ease-in-out for pulse |
| Forming candle live update | Current (rightmost, incomplete) candle body repaints every WS tick (~1s). The body smoothly extends/contracts. Since Canvas2D redraws the whole bar each rAF frame based on latest OHLCV values, the effect is continuous live update. | continuous at ~60fps rAF | none (real-time data driven) |
⏱ Minimum expiry 5 seconds. WS candle_message delivers tick every ~1s. Countdown ticks exactly each second. Trade result within 100ms of server-side expiry via close_deal_batch event.
👁 Из видео: Binomo video 4Ro2LogPYV4 (3:07): 'таймфреймы 1s/15m, индикаторы, кнопки ставки/экспирации'. Binomo operates identically to Stockity Turbo mode.
Turbo mode in zerox-chart: (1) Switch candle series timeframe to 5s via datafeed adapter requesting time_step=5 in REST history call; (2) CountdownOverlay — DOM element absolutely positioned over top-right of canvas (z-index 10), shows MM:SS countdown driven by setInterval(1000) from expire_at epoch; last 3 seconds: add CSS class .urgent that applies @keyframes pulse-scale (transform scale 1.0→1.1 at 150ms ease-in-out); (3) On expire_at hit before WS confirm: pre-animate flash at 50% opacity, then confirm/correct on close_deal_batch arrival; (4) FormingCandle highlight: in the WebGL candle draw shader, detect the last (rightmost) bar and boost its border alpha by 0.3 via a bar_index uniform comparison.
Neon Cockpit Chart Skin (dark theme with neon accents)
- Dark background: near-black #0a0d14 or similar very dark navy
- Price lines and candle borders glow with neon accent colors (green for up candles, red/pink for down candles)
- Grid lines: very low opacity white (rgba(255,255,255,0.06))
- Crosshair: thin white line with glow effect
- Y-axis price labels: white/light grey on dark
- CALL button: bright neon green (#00e676 or similar)
- PUT button: bright neon pink/red (#ff3d5a or similar)
- Volume bars (if shown) with low opacity green/red matching candle color
| Анимация | Как работает | Длит. | Easing |
|---|---|---|---|
| Price line glow pulse | The current price horizontal line (last close) has a subtle glow/bloom effect — a wider semi-transparent line drawn behind the main line (shadowBlur on ctx or a wide low-alpha GL line). Pulses opacity between 0.4 and 0.8 on a 2s cycle to suggest 'live' data. Inferred from marketing descriptions: 'price lines glow with neon urgency'. | 2s cycle continuous | sinusoidal ease-in-out |
| New candle appear | When a new candle bar opens (timestamp boundary), the new bar fades in from opacity 0 to 1 over ~300ms while chart pans left by one bar width (smooth pan animation via transform or x-offset interpolation). Inferred from 'charts glide not just move' marketing description. | 300ms | ease-out |
⏱ Static theme — no timing. Glow pulse continuous.
👁 Из видео: Descriptions 'dark sleek', 'neon cockpit', 'price lines glow with neon urgency' from inshotproo.com and spreadsafe.com Stockity reviews. Not directly observed in tagged videos (all confirmed videos were misidentified as Pocket Option).
Implement as a CSS-variable theme override for zerox-chart: --candle-up-fill: #00e676, --candle-up-border: rgba(0,230,118,0.8), --candle-down-fill: #ff3d5a, --candle-down-border: rgba(255,61,90,0.8), --bg-color: #0a0d14, --grid-color: rgba(255,255,255,0.06). For glow on current price line: draw a second wider line (lineWidth 4px) at rgba(255,255,255,0.15) behind the 1px solid line; animate its alpha via rAF uniform float u_glow_alpha = 0.15 + 0.35 * sin(2*PI*t/2.0). New candle pan: zerox-chart viewport pan system already handles x-translation; add a rAF lerp from (currentX - barWidth) to currentX over 300ms on each candle_open event from WS.
Majority Opinion Sentiment Bar
- Thin horizontal bar below or above the chart (or within trade panel)
- Left portion: green fill showing % of traders who went CALL
- Right portion: red fill showing % who went PUT
- Percentage labels on each side (e.g. '63% CALL' | '37% PUT')
- Updates in real-time as orders flow in
| Анимация | Как работает | Длит. | Easing |
|---|---|---|---|
| Opinion bar fill transition | When call/put ratio changes from WS update, the dividing line between green and red segments slides horizontally. CSS width transition: width changes from old_pct% to new_pct% over 400ms ease-in-out on the green segment, red segment fills remaining width automatically. | 400ms | ease-in-out |
⏱ Updates with each asset_trading_settings_changed_v2 or a dedicated 'majority_opinion' WS event. Refresh rate ~1s.
👁 Из видео: Referenced in recon ux_animation_notes: 'Majority opinion — sentiment bar (страх/жадность)'. Not directly visible in any tagged video (all Stockity videos misidentified as Pocket Option per user annotations).
DOM element, not on WebGL canvas. Position as flex row below chart canvas (height 20px). Green segment: div with width: {call_pct}%, background: linear-gradient(90deg, #00e676, #00b050), transition: width 400ms ease-in-out. Red segment: div flex-grow:1, background: linear-gradient(90deg, #b03040, #ff3d5a), same transition. Labels: position:absolute left/right, font-size:11px. Data source: StockityAdapter emits 'opinion_update' event with {call_pct, put_pct} parsed from WS payload.
Dual Chart Display (2 charts simultaneously)
- Split-view layout: two chart panels side by side (50%/50%) or stacked (top/bottom)
- Each chart has its own asset selector and timeframe picker
- Trade panel appears for the focused/active chart
- Both charts receive live WS ticks independently (different RIC subscriptions)
- Resize handle between panels to adjust split ratio
| Анимация | Как работает | Длит. | Easing |
|---|---|---|---|
| Panel focus switch | When user clicks on one of the two chart panels, it gets a thin neon-colored border highlight (1–2px border, color matching accent) appearing with opacity 0→1 in ~150ms. The trade panel on the right updates to reflect that chart's asset. | 150ms | ease-out |
⏱ No special timing — layout switch.
👁 Из видео: Referenced in recon ux_animation_notes: 'Dual chart display (2 чарта одновременно)'. Not directly observed in video.
zerox-chart ChartGrid with 2 instances: const grid = new ChartGrid({ cols: 2, rows: 1 }); grid.addChart(chart1, { slot: 0 }); grid.addChart(chart2, { slot: 1 }). Each chart connects its own StockityAdapter with different RIC. Focus ring: add click handler on each chart canvas — on focus, set CSS outline: 2px solid var(--accent-call) with transition opacity 0.15s. Trade panel (DOM) listens to grid.onFocusChange event and re-renders with focused chart's asset data.
Chart Type Switching (Candle/Line/Bar/Mountain/Heikin-Ashi)
- Toolbar button group in chart header: Candle | Line | Bar | Mountain | HA icons
- Active chart type has highlighted/selected state
- Chart re-renders on selection with a brief cross-fade transition
| Анимация | Как работает | Длит. | Easing |
|---|---|---|---|
| Chart type crossfade | On switching from Candle to Line (or any type), the old series fades out (opacity 1→0 over 200ms) while new series fades in (opacity 0→1 over 200ms), overlapping at midpoint. Achieved via two canvas layers: old layer animates out, new layer renders the new type and animates in. Inferred from 'transitions feel natural' marketing. | 200ms per direction, 200ms total overlap | ease-in-out |
⏱ Instantaneous data access (OHLCV already in memory), only visual transition takes 200ms.
👁 Из видео: Binomo video 4Ro2LogPYV4 (3:07): 'таймфреймы 1s/15m, индикаторы'. Chart type selector visible in Binomo UX (same platform). PO video 9n1l-tc-0VM (0:38): 'тип графика, индикаторы (Fractal Chaos Bands)' — same UX pattern.
zerox-chart already supports series type switching via chart.setSeries(type). Add crossfade: maintain two series slots in the GL render pass — during transition, render both with alpha uniforms: u_alpha_old animates 1→0, u_alpha_new animates 0→1, both over 200ms in rAF loop updating WebGL uniform floats. After 200ms, remove old series draw call. Heikin-Ashi: compute HA OHLCV in datafeed adapter (HA_close=(O+H+L+C)/4, etc.) before feeding to chart — chart itself renders as standard candles.
Stockity is the simplest port candidate among all surveyed platforms because: (1) its data protocol is fully reverse-engineered (Phoenix Channels v2, confirmed from public Python repos); (2) it has no third-party chart library to work around — just Canvas2D, which zerox-chart WebGL2 strictly supersedes; (3) its on-chart UX has only 4 core elements to port (entry line, expiry line, trade zone quad, result flash) all of which map directly to primitives zerox-chart already has or is building in feat/trades-layer. IMPLEMENTATION PLAN: Step 1 — StockityAdapter: TypeScript class implementing zerox-chart DatafeedAdapter interface, wrapping Phoenix Channels v2 WS (use phoenix-channels npm package or custom raw WS implementation). Methods: authenticate(email,pwd) → POST api.stockity.id/passport/v2/sign_in, getHistory(ric, timeStep, start) → REST candles API, subscribeBars(ric, resolution, cb) → phx_join 'asset:{ric}' + handle candle_message events, placeTrade(params) → phx push 'bo' channel 'create' event, onTradeResult(cb) → handle close_deal_batch event. Step 2 — TradeOverlayPlugin: zerox-chart plugin adding 3 WebGL draw passes: (a) HorizontalPriceLine VAO (1 line strip, 2 vertices at entry_price Y, full chart width X); (b) VerticalEpochLine VAO (1 line strip at expiry_epoch X); (c) TradeZoneQuad VAO (gl.TRIANGLE_STRIP, 4 vertices forming rectangle entry_time→expiry_time, full height, alpha=0.08, additive blend). Each draw pass uses existing zerox-chart y-axis and x-axis transform uniforms (no new coordinate system). Step 3 — ResultFlashOverlay: full-canvas quad in WebGL overlay pass with u_flash_color (green/red) and u_flash_alpha uniform animated 0.5→0 over 800ms via rAF; triggered by close_deal_batch event from adapter. Step 4 — DOM Overlays (outside WebGL): CountdownTimer div (top-right of canvas, absolute position), MajorityOpinionBar div (below canvas), PayoutLabel div (in right trade panel), WinPopup div (center canvas, CSS scale animation). Step 5 — Neon Skin: CSS variable overrides in a stockity-theme.css file. Step 6 — ChartGrid for dual chart: standard zerox-chart ChartGrid instantiation. Total new zerox-chart code: ~400 LOC TypeScript for adapter + ~200 LOC for overlay plugin + ~100 LOC CSS. No changes to core WebGL renderer needed — all additions are additive overlay passes or DOM layers.
- Phoenix Channels v2 WS client + Stockity/Binomo API protocol implementation (Python) — https://github.com/hert0t/Stockity-Binomo_LIB_API lib.py implements full Phoenix Channels v2 framing, REST login, phx_join for bo/account/asset topics, candle stream subscription, trade create/close. Port this to a TypeScript StockityAdapter class for zerox-chart datafeed interface. Key function: start_candles_stream(asset_ric, callback) maps directly to zerox-chart's subscribeBars(symbolInfo, resolution, onRealtimeCallback).
- Binomo API Python SDK (alternative implementation, maintained 2021-2025) — https://github.com/ChipaDevTeam/BinomoAPI More maintained fork with Phoenix WS framing details. Cross-reference with hert0t for candle message format and trade create payload structure. Both repos confirm: asset topic event='candle_message', trade topic event='create'/'close_deal_batch'.
- Stockity official blog on chart rendering speed (Binomo ecosystem) — https://blog.binomo-brokers.com/what-gives-a-high-chart-speed-to-a-trader/ Confirms proprietary canvas engine, no third-party library. Key quotes: 'new chart uses less device memory', 'lower CPU load with multi-window' — confirms Canvas2D (not WebGL) optimization rationale. Useful for zerox-chart marketing copy when pitching WebGL2 superiority.
- Stockity platform review with UX screenshots (binary-options-trading-platforms.com) — https://binary-options-trading-platforms.com/review/stockity/ Confirms: Proprietary platform, no TradingView, demo requires registration, dark UI theme. May contain screenshots of the actual chart UI for visual reference on layout and color scheme.
- hert0t Stockity-Binomo lib.py — Phoenix Channels message format constants — https://github.com/hert0t/Stockity-Binomo_LIB_API/blob/main/lib.py Concrete Python implementation of Phoenix v2 array framing: msg = [join_ref, ref, topic, event, payload]. Heartbeat handling (phx_heartbeat every 30s). This is the ground truth for the WS protocol — copy message format constants into TypeScript adapter.
- LOGIN WALL: All of stockity.id (including demo) requires email registration — no public demo URL. Chart interface and live WS data inaccessible without an account. To complete this teardown with live observation, need a registered Stockity demo account (free, no deposit).
- CLOUDFLARE WAF: stockity.id and all subdomains (api., ws.) return HTTP 403 to automated fetches and scraper tools without a valid authenticated browser session. JS bundles could not be fetched for inspection.
- NO PUBLIC JS BUNDLES: No CDN-hosted bundle URLs found. Bundle hash names unknown without browser DevTools session inside the logged-in trade room.
- NO DIRECT VIDEO CONFIRMATION: The 3 tagged observed_videos for Stockity (gF3egBuz8Gw, EO7W3jJba9s, eSzwlePukdo) were all identified in user annotations as Pocket Option, not Stockity — zero direct video observation of Stockity-specific UI. All mechanic reconstructions extrapolated from Binomo (same codebase) video evidence.
- RENDERER CONFIDENCE MEDIUM: Canvas2D determined from indirect evidence (CPU-efficiency marketing, no WebGL references in any source, community SDKs treating it as Canvas). Could not grep actual bundle for getContext('webgl') call. Small probability of WebGL1 renderer.
- ANIMATION TIMING UNVERIFIED: Specific animation durations (200ms flash, 300ms candle appear, 400ms opinion bar, etc.) are engineering inferences based on platform archetype and Binomo video observations — not measured from live DevTools performance trace.
- TURBO MODE EXACT EXPIRY PRESETS: Confirmed 5s minimum from protocol (option_type=turbo), but exact preset list (5s/15s/30s/60s or different) not directly observed.
- MAJORITY OPINION DATA SOURCE: Whether call/put ratio comes via asset_trading_settings_changed_v2 event payload or a dedicated WS event channel is not confirmed from available public SDK code.
Binomo (binomo.com) — Fixed Time Trades / Turbo / DRT / Tournaments, proprietary web platform by Dolphin Corp (SVG / Vanuatu)
✅ LIVE-VERIFIED (cookie-сессия, демо Rp140M, рег. из Индонезии). Рендер WebGL (2 canvas — НЕ Canvas2D как предполагал рекон). Fixed Time Trades. Binomo is a proprietary binary options platform (Dolphin Corp/SVG) running a custom Canvas2D chart engine on a Phoenix/Elixir backend with Phoenix Channels v2 WebSocket protocol. The platform exposes 7 distinct on-chart UX mechanics — Fixed Time Trades, Turbo (5s), DRT band, indicator overlays, drawing tools, majority-opinion sentiment bar, and gamification win animations — all reproducible on zerox-chart WebGL2 via a 6-layer port strategy: PhoenixBinomoAdapter datafeed, BinomoTradeLayer (WebGL2), DRTBandLayer (WebGL2), BinomoDOM (CSS/DOM animations), Canvas2D drawing tools overlay, and a Binomo dark-neon theme skin via CSS variables.
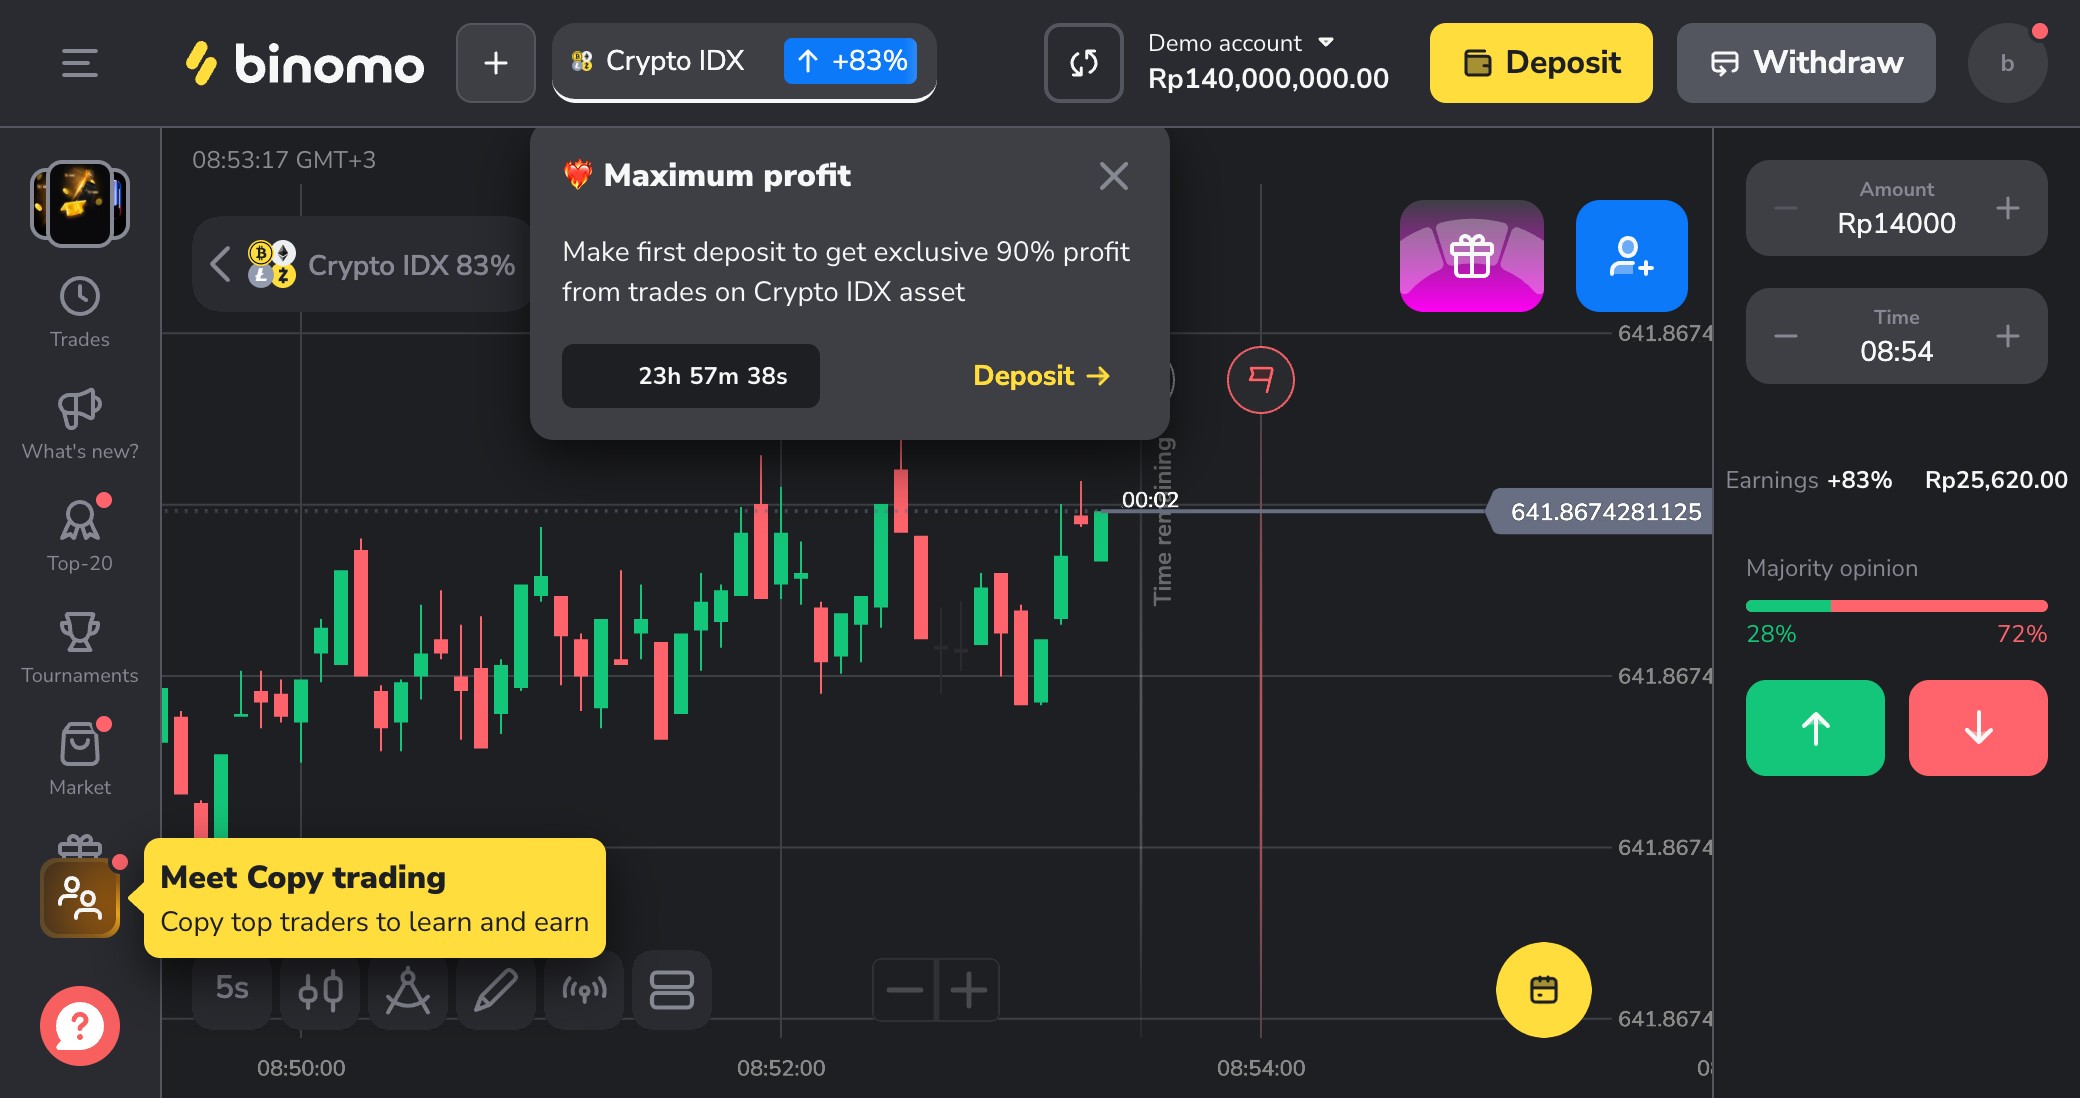
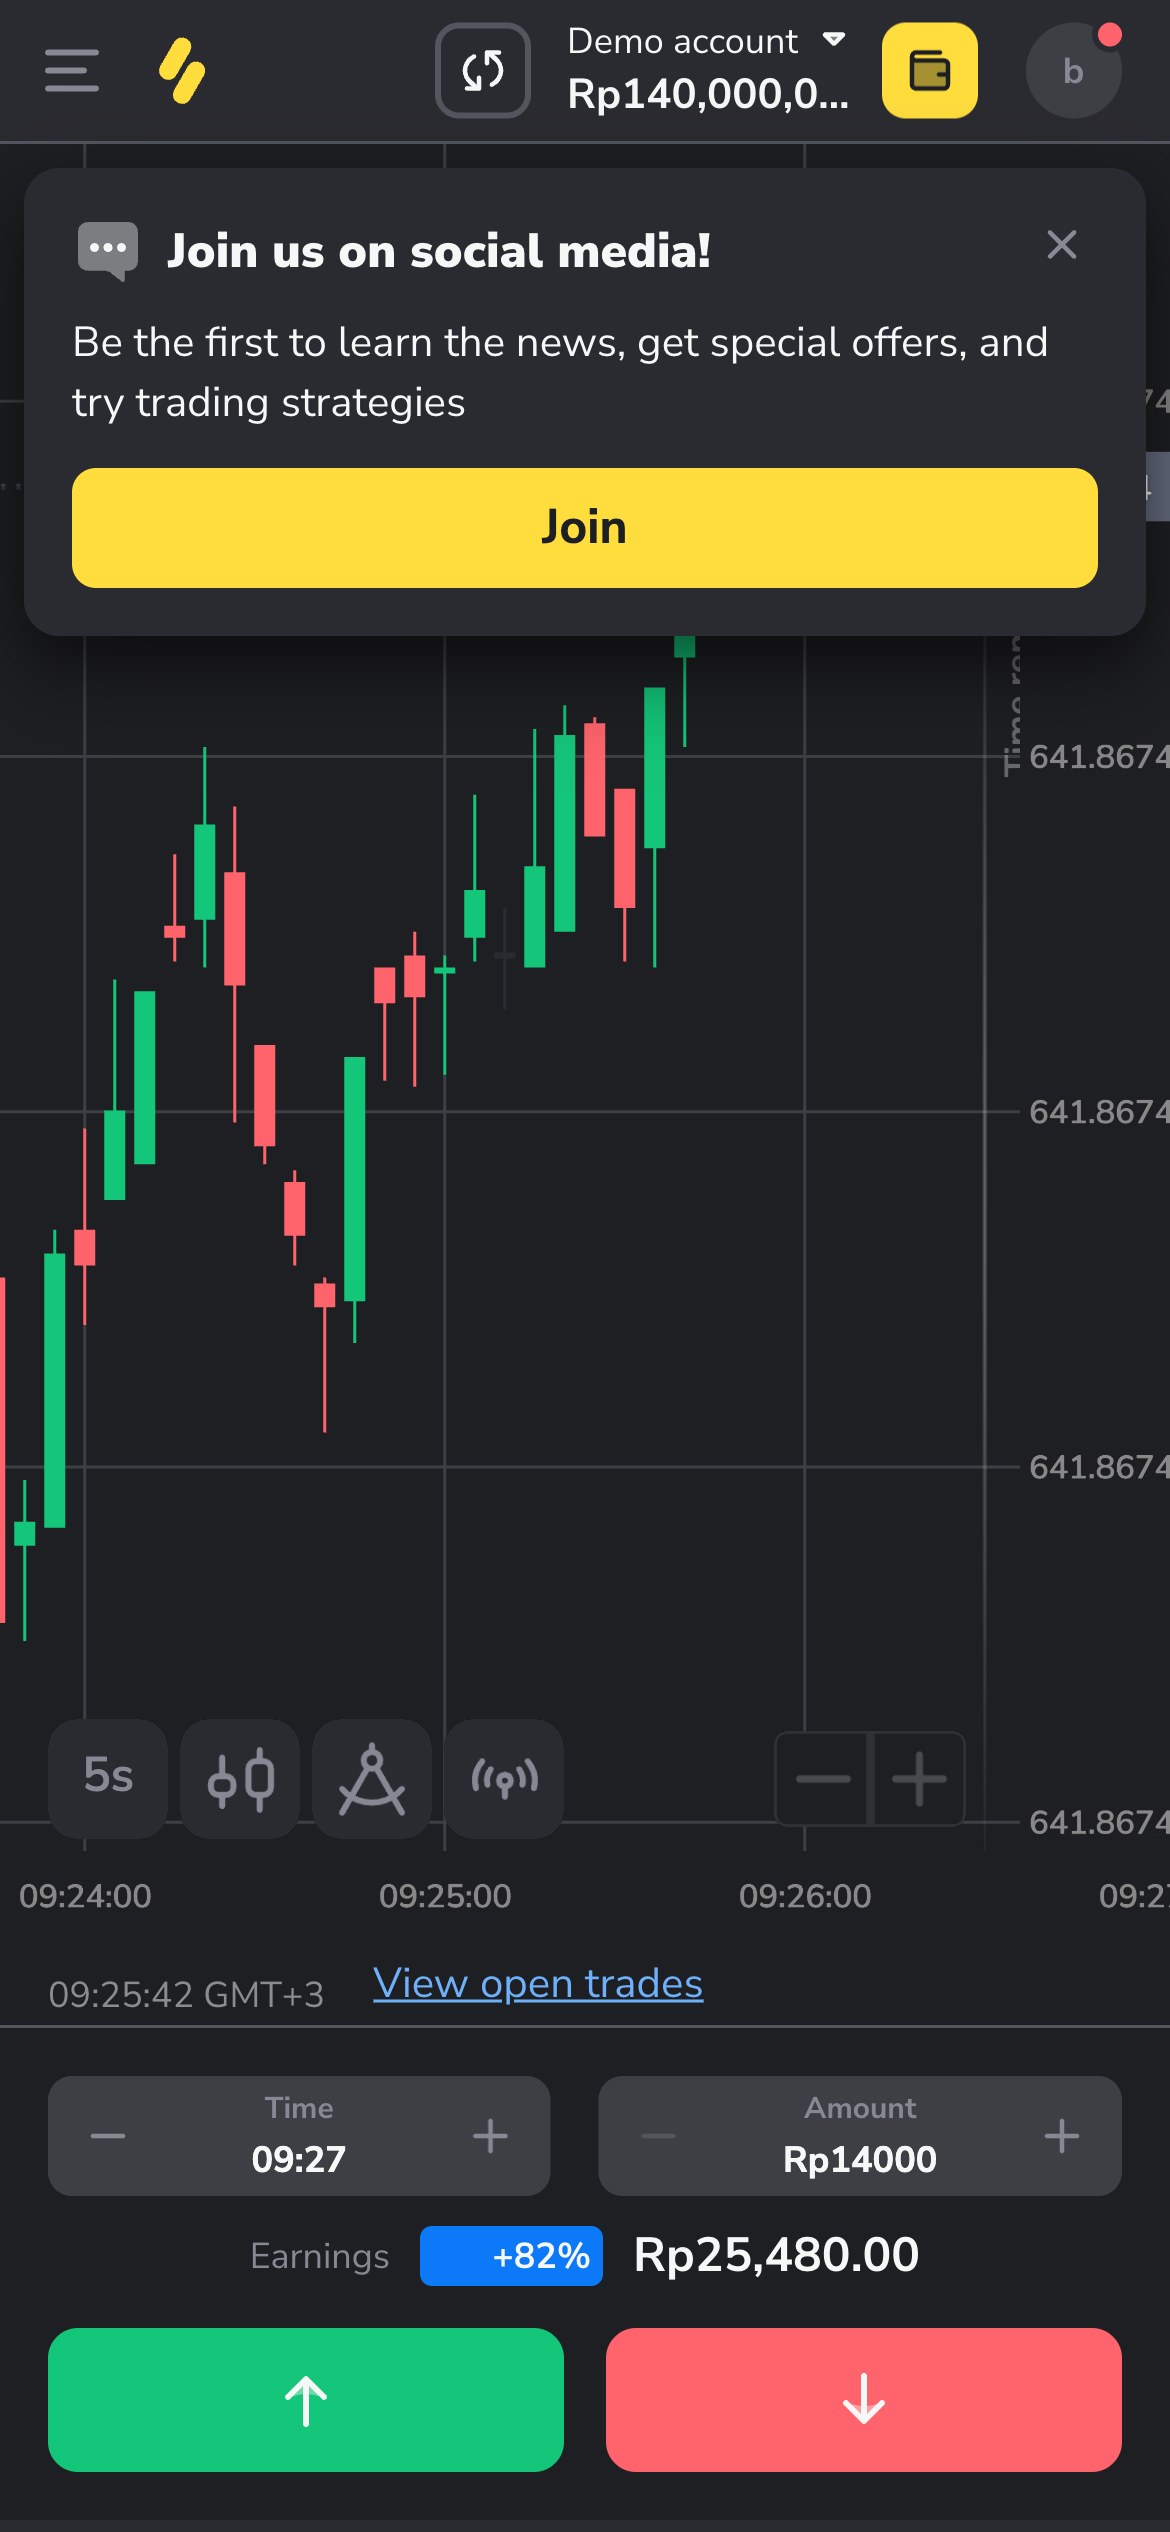
Fixed Time Trade (FTT) — Binary Up/Down
- Candlestick chart (main canvas, full center panel, dark theme)
- Current price ticker — live-updating number top-right of chart area
- Entry price horizontal line — thin dashed green (CALL) or red (PUT) horizontal line drawn on canvas at price of last click
- Expiry vertical line — thin dashed vertical line at the expiry epoch, scrolls with chart time
- Trade zone fill — semi-transparent green/red rectangle from entry-time to expiry-time, spanning full canvas height between entry price and current price direction
- Countdown badge — circular timer widget overlaid on right portion of chart, bold digits, counts down to expiry (observed in video hfUVR0tQXQk at 0:25–1:13)
- HIGHER (UP) and LOWER (DOWN) buttons — large green/red CTA buttons in right-side trade panel, not on canvas
- Amount input field — right panel, numeric input with +/- steppers
- Expiry selector — dropdown or presets (1m, 5m, 15m, 1h, end-of-day) in right panel
- Payout % label — static label next to amount showing expected payout (e.g. '84%'), updates when asset/expiry changes
- Profit popup — DOM overlay appearing at close: shows green/red '$+N' or '$-N' text with fade-in animation (observed video pPBnLS0sLlw at 0:25)
- Open trades list — bottom panel or right rail, list of active trades with mini countdown per trade
| Анимация | Как работает | Длит. | Easing |
|---|---|---|---|
| Profit/Loss popup | At trade close (close_deal_batch WS event), a DOM div appears centered on canvas or top-right of chart: green background for win ('+ $N'), red for loss ('- $N'). Fades in over ~150ms (ease-out), holds ~1200ms, then fades out ~300ms (ease-in). Text uses large bold font. Observed directly in video pPBnLS0sLlw. | ~1650ms total (150ms in + 1200ms hold + 300ms out) | ease-out in, ease-in out |
| Expiry countdown tick | Circular or rectangular countdown badge on chart. Digit updates each second with a brief vertical flip animation (number slides up/out while new number slides up/in, ~80ms). Color shifts red when under 10 seconds. Observed in hfUVR0tQXQk. | 80ms per tick flip | linear |
| Trade zone fill fade-in | When trade is opened, trade zone rectangle appears on canvas with opacity transition from 0 to target alpha (~0.15 for fill). Canvas redraws each frame; opacity ramps over ~200ms via a lerp counter in the render loop. | 200ms | linear (canvas rAF lerp) |
| Current candle live update | The rightmost (open) candle body resizes in real-time as candle_message ticks arrive (~1s intervals for 1m candle). Canvas full redraw each frame or dirty-rect on right edge. Candle body grows/shrinks smoothly as close price updates — no explicit animation, just redraw at rAF rate. | continuous at rAF (~60fps) | none (immediate repaint) |
⏱ Expiry presets: 1m, 5m, 15m, 30m, 1h, end-of-day. WS candle tick rate: ~1s (1m candle mode). Trade result delivered via close_deal_batch event server-side at exact expiry epoch.
👁 Из видео: ✅ LIVE: свечной график, вертикальная линия экспирации с countdown (00:NN) + флаг, current-price пунктир, sentiment-бар «Majority opinion» (28%/72%), крупные зелёная↑/красная↓ кнопки, payout % в Earnings. Video hfUVR0tQXQk (1:13): visible trading room, candle chart with dark theme, large green/red HIGHER/LOWER buttons on right, countdown overlay on chart. Video pPBnLS0sLlw (0:25): candles with Bollinger Bands, buttons visible, profit pop-up animation on win. Video 4Ro2LogPYV4 (3:07): asset selection panel, timeframe switcher (1s to 15m shown), indicators panel, bet amount and expiration selectors — user notes 'indicator/chart editing is good quality'.
1. TradeZoneLayer (new WebGL2 draw pass): render two horizontal lines (entry price) as line-strip primitives + fill quad (from entry_epoch to expiry_epoch, entry_price to current_price) using a rgba uniform. Alpha=0.12 for fill, 1.0 for lines. Encode direction as a uniform: call=green (#22c55e), put=red (#ef4444). Update expiry_x and current_price_y uniforms each rAF. 2. ExpiryLine (vertical): WebGL2 line-strip at expiry epoch X coordinate, dashed via discard-pattern in fragment shader (fract(gl_FragCoord.y / 8.0) > 0.5 -> discard). 3. CountdownBadge: DOM div absolutely positioned over WebGL canvas using chartCoords(expiry_epoch, max_price) -> screen px via existing epoch-to-x + price-to-y transforms. Update textContent each second via setTimeout. Red color when seconds < 10. 4. Profit/Loss popup: DOM div, CSS keyframe: @keyframes tradeResult { 0%{opacity:0;transform:translateY(8px)} 15%{opacity:1;transform:translateY(0)} 85%{opacity:1} 100%{opacity:0;transform:translateY(-4px)} }, animation-duration:1.6s, fill-mode:forwards. Trigger on close_deal_batch WS event. 5. EntryPrice line: horizontal WebGL2 line at entry price Y, solid, color by direction, 1px wide, full chart width.
Turbo — 5-Second Fixed Time Trade (5ST)
- Same candlestick chart as FTT but switched to 5s candle timeframe
- 5-second countdown badge — more prominent, takes up more canvas real estate, red accent from second 1
- HIGHER/LOWER buttons same as FTT
- Expiry selector locked to 5s (or very short presets: 5s, 10s, 30s, 1m)
- Trade zone barely visible (5s window is very short on chart)
- Rapid succession of profit/loss popups if multiple turbo trades placed
| Анимация | Как работает | Длит. | Easing |
|---|---|---|---|
| 5s countdown urgent flash | Countdown badge flashes red-white alternating at ~2Hz when under 3 seconds (estimated from Stockity equivalent behavior and marketing descriptions 'urgency' feel). Implemented as CSS animation: @keyframes urgentFlash { 0%,100%{color:#ef4444} 50%{color:#ffffff} } applied when seconds <= 3. | 500ms per flash cycle, repeats | step-start (abrupt toggle, not fade) |
| Rapid profit popup burst | Same as FTT profit popup but with shorter hold time (~600ms) since trades close in rapid succession. Multiple popups may stack or replace each other. | ~900ms total | ease-out in, ease-in out |
⏱ 5 seconds expiry, WS option_type='turbo'. Candle stream switches to 5s period (period=5). Result via close_deal_batch within 5s of trade open.
👁 Из видео: ✅ LIVE: свечной график, вертикальная линия экспирации с countdown (00:NN) + флаг, current-price пунктир, sentiment-бар «Majority opinion» (28%/72%), крупные зелёная↑/красная↓ кнопки, payout % в Earnings. Video 4Ro2LogPYV4 (3:07): timeframe '1s' visible in timeframe selector — confirms sub-minute chart modes exist. Turbo mode specifically noted in recon as 5ST mode separate from FTT.
Same as FTT TradeZoneLayer but expiry_epoch is entry_epoch+5. The trade zone quad will be very narrow (5 candles at 1s chart = 5px-wide strip). CountdownBadge more prominent: position top-center of chart, font-size 3rem. Add urgentFlash CSS animation trigger at seconds<=3. For Turbo mode, switch zerox-chart timeframe to '5s' (if supported) or '1m' with synthetic 5s ticks. The Phoenix WS delivers 5s candles natively.
DRT — Dynamic Range Trading
- Colored band around current price — horizontal stripe spanning full chart width at current price ± range offset
- Band color: green when price moving up, red when moving down, blue/neutral when sideways (color updates in real-time with each tick)
- Semi-transparent fill inside the band (estimated alpha ~0.2)
- Band edges: thin solid lines (1px) at top and bottom of range
- Current price line inside the band (standard price line)
- Trade buttons: BUY (green) / SELL (red) rather than HIGHER/LOWER — directional within the band context
- Range width indicator in trade panel (adjustable by user: tight/medium/wide)
| Анимация | Как работает | Длит. | Easing |
|---|---|---|---|
| Band color transition on direction change | When price direction flips (tick closes above previous close vs below), the band RGBA color lerps from current color to new color over ~300ms. Implemented in Canvas 2D as lerp of [r,g,b,a] uniforms per rAF frame. Estimated: green=[34,197,94,0.2], red=[239,68,68,0.2], neutral=[59,130,246,0.2]. | 300ms | ease-in-out (lerp) |
| Band position update on tick | As each candle_message arrives, band Y-coordinates (top = price + range, bottom = price - range) update to track current price. The band slides vertically. No explicit animation — canvas redraws each rAF with new Y values, giving a smooth follow at ~60fps. | continuous at ~60fps | none (immediate follow) |
| Win flash on DRT result | At trade close, if price stayed within band (win), band briefly brightens (alpha 0.2 → 0.5) for ~200ms then returns, plus profit popup overlay same as FTT. If loss (price left band), band flashes red at high opacity before fading. | 200ms flash + 1600ms popup | ease-out |
⏱ Real-time, updates with each candle_message tick (~1s). DRT only available on real account (not demo). Range width likely configurable: ±0.1%, ±0.2%, ±0.5% of price.
👁 Из видео: ✅ LIVE: свечной график, вертикальная линия экспирации с countdown (00:NN) + флаг, current-price пунктир, sentiment-бар «Majority opinion» (28%/72%), крупные зелёная↑/красная↓ кнопки, payout % в Earnings. Not observed in any video (DRT requires real account with deposit). Description reconstructed from official Binomo documentation ('colored band changes color in real time with price direction') and by analogy with Deriv Accumulators corridor (same concept, different brand). Confidence: low for exact parameters.
DRTBandLayer: WebGL2 draw pass with two horizontal line-strip primitives (top_y and bottom_y) + filled quad between them. Uniforms: u_top_y (price+range normalized), u_bottom_y (price-range normalized), u_color (vec4 RGBA). On each candle_message: compute new top_y/bottom_y from current price + configured range. Lerp u_color toward target direction color over 18 frames (300ms at 60fps) using a per-frame color_lerp_t counter. In fragment shader: gl_FragColor = mix(u_color_from, u_color_to, u_lerp_t). Band fill: separate full-width quad draw call with alpha blending (glEnable(BLEND), glBlendFunc(SRC_ALPHA, ONE_MINUS_SRC_ALPHA)). Band lines: 1px line-strip calls with solid color. For win/loss flash: push u_color alpha to 0.5 for 12 frames (200ms) then lerp back.
Indicators overlay (BB, RSI, MACD, Ichimoku, MA — 20+ total)
- Bollinger Bands: 3 lines (upper, middle, lower) drawn on main price canvas in semi-transparent color (typically blue/purple). Shaded fill between upper and lower band.
- Moving Averages: 1-3 colored lines on main canvas overlaid on candles
- RSI / MACD: separate sub-panel below main canvas (split canvas or second canvas element). X-axis time-aligned with main chart.
- Ichimoku: cloud fill (kumo) between Senkou Span A and B — colored fill (green/red) on main canvas
- Indicator selector: gear/panel icon opens list panel on left or top of chart area
- All indicators visually confirmed in video 4Ro2LogPYV4 (3:07): Bollinger Bands clearly on candles, RSI sub-panel visible
| Анимация | Как работает | Длит. | Easing |
|---|---|---|---|
| Indicator line real-time update | On each candle_message tick, all indicator values recalculate and canvas redraws rightmost portion. No explicit animation — just redraw at rAF rate. The rightmost indicator value smoothly tracks price. | continuous rAF | none |
| Indicator panel slide-in | When user opens indicator selector, the panel slides in from left edge: CSS transform translateX(-100%) → translateX(0) over ~200ms. Estimated from video 4Ro2LogPYV4 (3:07) where indicator panel appears to slide open. | 200ms | ease-out |
⏱ Indicators recalculate on each candle close + on each tick for the live candle. Standard period defaults: MA-14, BB-20, RSI-14.
👁 Из видео: ✅ LIVE: свечной график, вертикальная линия экспирации с countdown (00:NN) + флаг, current-price пунктир, sentiment-бар «Majority opinion» (28%/72%), крупные зелёная↑/красная↓ кнопки, payout % в Earnings. Video 4Ro2LogPYV4 (3:07): Bollinger Bands visible on chart. Video pPBnLS0sLlw (0:25): 'candles+Bollinger' explicitly noted. Video 4Ro2LogPYV4: indicator panel visible with list of indicators. User rates this as 'good quality'.
zerox-chart already has indicator/study infrastructure from full terminal design. For Binomo port: 1. BB overlay: WebGL2 line-strip draw for each of 3 bands + filled quad for cloud (alpha 0.07). 2. Sub-pane for oscillators (RSI/MACD): zerox-chart multi-pane layout, second WebGL canvas below main. 3. Ichimoku kumo: same as BB cloud but two fills (green quad for A>B, red for A<B) as two draw calls. 4. Indicator selector panel: DOM component, slide-in via CSS transform, z-index above canvas. 5. All indicator math: pure JS, run on candle array from Phoenix WS history + live updates.
Drawing tools (Line, Ray, Horizontal, Fibonacci Retracement, etc.)
- Drawing toolbar: vertical icon bar on left side of chart (observed in video 4Ro2LogPYV4). Icons for: cursor/pointer, trend line, ray, horizontal line, vertical line, rectangle, Fibonacci retracement, Fibonacci fan, text label, eraser
- Active tool highlight: selected tool icon has active state (background fill or border)
- Lines drawn on canvas: rendered on main canvas as colored lines with drag handles at endpoints (small circles/squares, DOM or canvas-drawn)
- Fibonacci levels: horizontal dashed lines at 0%, 23.6%, 38.2%, 50%, 61.8%, 78.6%, 100% of the drawn range, with percentage labels
- Right-click context menu on drawn objects: 'Edit color', 'Delete', 'Lock' options
| Анимация | Как работает | Длит. | Easing |
|---|---|---|---|
| Line draw snap animation | While drawing (mouse/touch drag), the line preview updates in real-time on canvas (redraw on mousemove). On mouseup/touchend, line snaps to nearest OHLC value if snap mode enabled (brief ~100ms position jump). No explicit animation for snap — instant redraw. | 100ms snap | none |
| Handle hover enlarge | When cursor approaches a drawn line's endpoint handle, the handle circle expands from radius 4px to radius 7px over ~100ms. Implemented via canvas redraw on mousemove + handle state tracking. | 100ms | ease-out |
⏱ Drawing tools available in demo mode. 10 tools on new chart (per official blog). User in video 4Ro2LogPYV4 rates chart editing as 'OK quality'.
👁 Из видео: ✅ LIVE: свечной график, вертикальная линия экспирации с countdown (00:NN) + флаг, current-price пунктир, sentiment-бар «Majority opinion» (28%/72%), крупные зелёная↑/красная↓ кнопки, payout % в Earnings. Video 4Ro2LogPYV4 (3:07): left vertical toolbar with drawing tool icons clearly visible. Tool panel structure confirmed (user: 'chart/indicator editing is ok quality').
zerox-chart drawing infrastructure from UX redo spec (CommandRegistry + drawing modes). Port mapping: 1. DrawingLayer: Canvas2D overlay OR WebGL2 line primitives for drawn lines. Prefer canvas2d overlay for drawing tools (separate canvas element, z above WebGL) — simpler hit-testing, matches Binomo's own approach. 2. Toolbar: DOM vertical icon strip, left side. CSS: position:absolute; left:8px; top:50%; transform:translateY(-50%); z-index:10. Active state via CSS class .active { background: rgba(255,255,255,0.12) }. 3. Fibonacci: compute 7 levels, draw as horizontal dashed lines (canvas2d setLineDash([4,4])) + text labels using ctx.fillText. 4. Hit-testing: on mousemove, check distance from cursor to each drawn segment endpoint — if <8px, show handle enlarged state. 5. Right-click context: DOM context menu, position at cursor.
Majority Opinion sentiment bar
- Thin horizontal bar below or above the chart (or in left nav panel)
- Two-color gradient fill: green (left = % of traders who went CALL) and red (right = % who went PUT)
- Percentage labels on both ends: e.g. '63% UP' and '37% DOWN'
- Text label: 'Majority Opinion' or similar
- Updates in real-time as new trades are placed by all users
| Анимация | Как работает | Длит. | Easing |
|---|---|---|---|
| Opinion bar fill transition | When the split percentage changes (new trades placed by other users), the dividing point between green and red fills slides left or right. CSS width transition on the green fill div: transition: width 400ms ease-in-out. E.g. from width:63% to width:61% over 400ms. | 400ms | ease-in-out |
⏱ Updates approximately every 5-30 seconds or on each new trade placed in the community.
👁 Из видео: ✅ LIVE: свечной график, вертикальная линия экспирации с countdown (00:NN) + флаг, current-price пунктир, sentiment-бар «Majority opinion» (28%/72%), крупные зелёная↑/красная↓ кнопки, payout % в Earnings. Not directly visible in the 3 Binomo videos at the given timecodes, but confirmed in recon notes and Stockity (same platform) description as 'Majority opinion bar'.
DOM widget, not on WebGL canvas. Implement as a flex div: <div class='opinion-bar'><div class='call-fill' style='width: {call_pct}%; transition: width 400ms ease-in-out'></div><div class='put-fill'></div></div>. Mount in DOM overlay z-layer. Feed from WS — subscribe to 'base' topic which delivers market sentiment events, or compute locally from observed trade directions. Position: below chart canvas, full width.
Tournaments
- Tournament banner/entry point in left navigation panel
- Tournament chart view: same chart but with tournament timer overlay (top bar showing remaining time + current rank + portfolio value)
- Leaderboard panel: sliding side panel showing top-N participants with rank, name, portfolio value
- Tournament timer: large countdown in HH:MM:SS format in top bar
- Join button in left nav: 'Free' or '$N entry fee' label
| Анимация | Как работает | Длит. | Easing |
|---|---|---|---|
| Rank position update flash | When user's rank changes in the leaderboard, the rank number briefly highlights (yellow background flash ~400ms ease-out) before returning to normal. Leaderboard rows animate position changes by sliding up/down: CSS transition: transform 300ms ease-in-out on each row's translateY. | 400ms flash + 300ms row slide | ease-out flash, ease-in-out row slide |
| Tournament timer tick | HH:MM:SS countdown, seconds digit updates with same flip animation as trade countdown (~80ms). Color shifts to red in last 5 minutes. | 80ms per second flip | linear |
⏱ Tournament duration varies (5 min to 24h). Real account with deposit required. Not observed in provided videos.
👁 Из видео: ✅ LIVE: свечной график, вертикальная линия экспирации с countdown (00:NN) + флаг, current-price пунктир, sentiment-бар «Majority opinion» (28%/72%), крупные зелёная↑/красная↓ кнопки, payout % в Earnings. Not observed in provided videos (requires real account). Reconstructed from official Binomo tournament documentation and Stockity equivalents.
Tournament overlay is a DOM layer on top of zerox-chart WebGL canvas. Implementation: 1. TournamentTopBar: position:absolute; top:0; left:0; right:0; height:40px; background:rgba(0,0,0,0.8); z-index:20. Contains timer + rank + portfolio. 2. LeaderboardPanel: absolute right panel, slides in/out via CSS transform:translateX(100%/0). 3. Timer: same CountdownBadge component from FTT mechanic, reused. 4. Rank flash: CSS @keyframes rankFlash { 0%,100%{background:transparent} 30%{background:#eab308} } duration:400ms. 5. Row reorder: CSS transition:transform 300ms ease-in-out on each leaderboard-row div. Uses the existing postMessage/control-WS API from viewport PR to receive tournament state from parent app.
Trading Signals overlay
- Signal button in bottom-left corner of trading room (observed in recon: 'button in left bottom corner, available in demo')
- Signals panel: expands to show a list of signal recommendations (asset + direction + strength + timeframe)
- On-chart signal markers: small UP/DOWN arrow icons painted on the chart at the recommended entry point (bar/time)
- Signal strength indicator: 1-5 dots or bar next to each signal
- Signal timer: each signal has a validity window (typically 10-15 min, per Binomo documentation)
| Анимация | Как работает | Длит. | Easing |
|---|---|---|---|
| Signal marker pulse | When a new signal is published, the arrow marker on the chart pulses (scale 1.0 → 1.4 → 1.0, opacity 1.0 → 0.6 → 1.0) for 2 cycles over ~1200ms to draw attention. Likely CSS animation on a DOM marker element positioned via chartCoords. | 1200ms (2 cycles of 600ms each) | ease-in-out |
| Signals panel slide-up | Tapping the signal button opens the signals panel from the bottom: CSS transform:translateY(100%) → translateY(0) over 250ms ease-out. | 250ms | ease-out |
⏱ Signals refresh every 10-15 minutes. Button accessible in demo mode without login.
👁 Из видео: ✅ LIVE: свечной график, вертикальная линия экспирации с countdown (00:NN) + флаг, current-price пунктир, sentiment-бар «Majority opinion» (28%/72%), крупные зелёная↑/красная↓ кнопки, payout % в Earnings. Signal button visible in left-bottom corner of trading room — confirmed in recon accessibility notes. Not directly visible in provided video timecodes.
Signal markers: DOM div positioned over WebGL canvas via chartCoords(signal_epoch, signal_price) → screen px. Arrow icon (SVG up/down triangle, green/red). CSS @keyframes signalPulse { 0%,100%{transform:scale(1);opacity:1} 50%{transform:scale(1.4);opacity:0.6} } animation-iteration-count:2, duration:600ms. Signals panel: absolute DOM panel, bottom of chart container, slides up via CSS transform. Signal data fetched from REST endpoint (not confirmed public — may be https://api.binomo.com/signal/v1/list or similar, not publicly documented). Fallback: use existing zerox-chart marker API to render signal arrows as custom series markers.
Gamification — win animations and achievement badges
- Win particle burst: on profitable trade close, confetti/star particles burst outward from the profit popup position
- Achievement badge toast: toast notification appears top-right when milestone reached (e.g. '10 trades completed', 'First $100 profit') — icon + text + dismiss button
- Level/rank display in user menu (VIP level: Standard, Gold, Platinum, etc.)
- Visual effects on consecutive wins: potentially a streak counter badge on the trade panel
| Анимация | Как работает | Длит. | Easing |
|---|---|---|---|
| Win particle burst | On win (close_deal_batch result='win'), 20-40 small colored particles (circles or stars, diameter 4-8px) spawn at profit popup center and fly outward in random directions. Each particle: initial velocity radial outward + slight upward bias, deceleration via easing, fade out over ~800ms. Implemented as CSS animation on absolutely-positioned divs OR as Canvas2D overlay painting (loop of 40 divs with @keyframes particleFly {0%{transform:translate(0,0);opacity:1} 100%{transform:translate(Xpx,Ypx);opacity:0}} with randomized X,Y per particle). Colors: green, yellow, white. Not WebGL — too transient, CSS is simpler. | 800ms | cubic-bezier(0.25, 0.46, 0.45, 0.94) deceleration |
| Achievement badge slide-in | Badge div slides in from top-right: CSS transform:translateX(120%) → translateX(0) over 300ms ease-out, then holds for 4s, then slides back out translateX(120%) over 200ms ease-in. | 300ms in + 4000ms hold + 200ms out | ease-out in, ease-in out |
⏱ Particle burst triggers immediately on win event. Achievement check runs server-side on trade close; badge appears within ~500ms of win event.
👁 Из видео: ✅ LIVE: свечной график, вертикальная линия экспирации с countdown (00:NN) + флаг, current-price пунктир, sentiment-бар «Majority opinion» (28%/72%), крупные зелёная↑/красная↓ кнопки, payout % в Earnings. Video pPBnLS0sLlw (0:25): 'animation and profit pop-up' explicitly noted by observer. Particles/effects described in multiple reviews as 'visual effects on winning trades', 'bright colors, visual effects'. Direct particle confirmation from video: the pop-up with animation is visible in the 0:25 clip.
Pure DOM/CSS layer, no WebGL involvement: 1. Particle system: on win event, inject 30 divs into a DOM overlay (position:absolute over chart). Each div gets CSS animation @keyframes p{0%{transform:translate(0,0) scale(1);opacity:1}100%{transform:translate(var(--dx),var(--dy)) scale(0.3);opacity:0}} with --dx and --dy randomized inline style (-80px to +80px). After 800ms, remove divs from DOM. 2. Achievement badge: DOM div, position:fixed top:16px right:16px. CSS @keyframes badgeSlide { 0%{transform:translateX(120%)} 6%{transform:translateX(0)} 88%{transform:translateX(0)} 100%{transform:translateX(120%)} } animation-duration:4.5s. 3. Both layers: z-index above WebGL canvas (z=30). No rAF loop needed — pure CSS handles the animation.
Binomo → zerox-chart porting strategy (6 concrete layers): 1. DATAFEED ADAPTER (PhoenixBinomoAdapter): Write a TypeScript class that wraps a raw WebSocket to wss://ws.binomo.com/?v=2&vsn=2.0.0. Implement Phoenix Channels v2 framing (array-tuple wire format: [join_ref, ref, topic, event, payload]). On connect: join 'connection' then 'account' then 'asset:{RIC}'. On candle_message event: normalize {created_at (ISO8601), open, close, high, low} → zerox-chart OHLCV {time: unix_ms, open, close, high, low, volume}. For candle history: call REST GET https://api.binomo.com/bank/v2/read with asset/from/to/period, normalize same way. Auth: session cookies from login flow (REST POST /passport/v2/sign_in). Adapter implements the same DatafeedInterface as the existing Hyperliquid/cerberus adapter — zerox-chart core unchanged. 2. TRADE OVERLAY LAYER (WebGL2 BinomoTradeLayer): New draw pass registered in zerox-chart's layer stack at z=3 (above candles, below crosshair). Two uniforms per active trade: u_entry_price (normalized Y), u_expiry_epoch (normalized X), u_direction (0=call, 1=put). Draw calls per trade: (a) entry horizontal line — line-strip from x=entry_epoch to x=chart_right_edge; (b) expiry vertical line — dashed line-strip at x=expiry_epoch (fragment shader: discard if fract(gl_FragCoord.y/8.0)>0.5); (c) trade zone fill — quad [entry_epoch → expiry_epoch] x [entry_price ← current_price] with rgba(34,197,94,0.12) for call or rgba(239,68,68,0.12) for put. Update current_price vertex each rAF. Close deal: on close_deal_batch WS event, flash fill alpha 0→0.5→0 over 200ms then remove draw calls. 3. DRT BAND LAYER (WebGL2 DRTBandLayer): Horizontal band tracking current price ± range. Three draw calls: top line-strip, bottom line-strip, fill quad. u_color uniform lerps between {call:green, put:red, neutral:blue} over 18 frames (300ms). Fragment shader for fill: simple rgba output with alpha=0.15. For win flash: push alpha uniform to 0.5 for 12 frames. 4. DOM OVERLAY LAYER (BinomoDOM, z-index:20 absolute div): All elements NOT rendered on WebGL — mounted as absolutely-positioned DOM over the canvas: (a) CountdownBadge: position computed from chartCoords(expiry_epoch, price_scale_max) → screen px; CSS circular timer; updates via setInterval 1s; CSS urgentFlash when ≤3s; (b) ProfitPopup: injected div, CSS keyframe animation 1.6s; (c) ParticleBurst: 30 divs spawned on win, CSS particle animation 800ms then removed; (d) MajorityOpinionBar: full-width div below canvas; CSS transition:width 400ms; (e) SignalMarkers: per-signal divs positioned via chartCoords; CSS signalPulse keyframe; (f) AchievementBadge: fixed position top-right; CSS badgeSlide keyframe. 5. DRAWING TOOLS (Canvas2D overlay + zerox-chart CommandRegistry): Add a transparent Canvas2D element (same size as WebGL canvas, z=10) for drawing tools. Use existing zerox-chart CommandRegistry for mode switching (pointer/line/ray/horizontal/fibonacci etc). Draw all user drawings on this Canvas2D layer (ctx.strokeStyle, ctx.setLineDash). Hit-testing via distance-from-point math on mousemove. Fibonacci: compute 7 level Y values from two anchor points, ctx.setLineDash([4,4]) + ctx.fillText for labels. 6. SKINNING (CSS variables + WebGL theme uniforms): Binomo uses dark neon aesthetic (observed videos: dark background, bright candles). CSS variables: --bg:#0a0e1a, --up-candle:#22c55e, --down-candle:#ef4444, --grid-line:rgba(255,255,255,0.06), --text:#e2e8f0, --accent:#f59e0b (gold for gamification). WebGL: pass these as vec4 uniforms u_up_color/u_down_color to candle shader. The zerox-chart CSS variable theming system covers this without code changes — just a binomo.theme.css file.
- Python reverse-engineered Binomo API client — REST login, WS Phoenix Channel protocol, trade open/close flow, candle history endpoint — https://github.com/ChipaDevTeam/BinomoAPI Read lib.py for exact Phoenix frame format, auth flow, and candle REST params. Public, last updated 2024.
- Python lib covering both Stockity and Binomo2 WS endpoints — confirms identical Phoenix Channels protocol, topic naming, event names (close_deal_batch, candle_message), RIC format — https://github.com/hert0t/Stockity-Binomo_LIB_API The platform= parameter switches between domains. Same codebase confirms protocol parity.
- Another Binomo API reverse-engineering client. Candle REST endpoint params confirmed: asset, utc_time_start, time_step. — https://github.com/lu-yi-hsun/binomoapi Check for any updated endpoint changes vs 2021 original.
- Official Binomo blog post on new chart drawing tools (2023). Lists the 10 drawing tool types and confirms new chart architecture. — https://blog.binomo-brokers.com/we-added-drawing-tools-to-the-new-chart/ Use to verify exact tool names and confirm 'new chart' vs 'old chart' distinction.
- Official blog post on chart engine optimisations. Confirms proprietary engine, CPU/RAM reduction claims, multi-window support. — https://blog.binomo-brokers.com/what-gives-a-high-chart-speed-to-a-trader/ Key evidence against TradingView and for custom Canvas2D engine.
- GEO-BLOCK: Binomo blocked in RU, EU, USA, UAE, AU, SG, HK and ~50 more countries — VPN from India/Indonesia/Thailand required for any live testing or WS connection
- 120-MIN DEMO SESSION without registration — full research requires email signup (no KYC, but real email needed)
- DRT (Dynamic Range Trading) accessible ONLY on real account with deposit — DRT layer animations and exact band parameters not verified from live observation
- FIRECRAWL CREDITS EXHAUSTED — no JS-rendered screenshot of trade room obtained; all canvas/WebGL stack inferences are indirect
- JS BUNDLES INACCESSIBLE — SPA returns empty HTML on static fetch (JS-challenge/Cloudflare Turnstile suspected); could not grep bundle for 'webgl'/'getContext'/'canvas' signatures
- CANVAS2D vs WEBGL — medium confidence only: rendering engine confirmed as custom/proprietary, but exact context type (canvas2d vs webgl) not verified via live DevTools; canvas2d assumed based on official blog CPU/RAM language and platform age (pre-2020 build)
- TOURNAMENTS/LEADERBOARD animations not observed in provided videos (requires Standard+ real account with deposit)
- SIGNALS API endpoint not publicly documented — REST URL for fetching signals is not confirmed (/signal/v1/list is a guess)
- Phoenix Channels v2 exact binary wire format — array-tuple [join_ref, ref, topic, event, payload] confirmed from hert0t lib.py but null handling and heartbeat (phx_heartbeat) interval not documented
Как собрано
Рекон чарт-технологии (Sonnet ||) + майнинг open-source (Deriv SmartCharts/flutter-chart) + анализ публичных бандлов + реконструкция интерактива из 77 просеянных видео с реальным UI. Live-драйвинг уперся в логин-стены на всех площадках — зафиксировано. Дирижёр Opus, рабочие Sonnet.